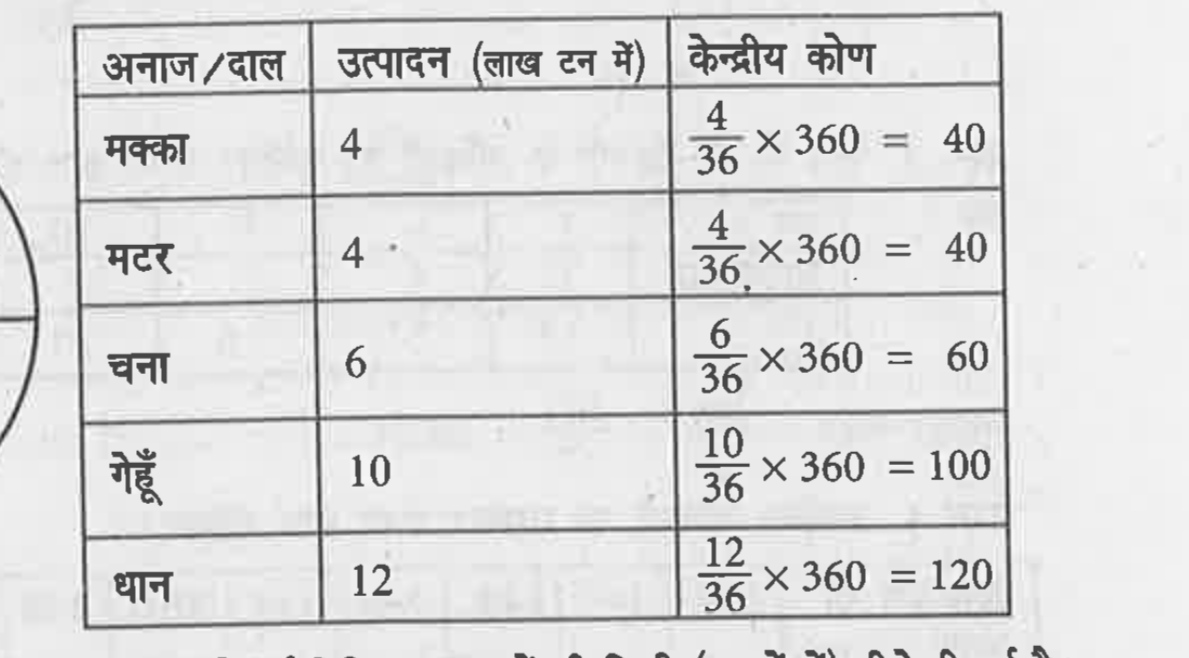
नीचे दी गई तालिका में किसी क्षेत्र के एक वर्ष में विभिन्न खाद्यानों में उत्पादन के आँकड़े दिए गए हैं। आँकड़ों का पाई ग्राफ निरूपण कीजिए ।

Step by step video & image solution for नीचे दी गई तालिका में किसी क्षेत्र के एक वर्ष में विभिन्न खाद्यानों में उत्पादन के आँकड़े दिए गए हैं। आँकड़ों का पाई ग्राफ निरूपण कीजिए । by Maths experts to help you in doubts & scoring excellent marks in Class 7 exams.
Updated on:21/07/2023Topper's Solved these Questions
Similar Questions
निम्नांकित के मान बताइए।4x⋅(−7x)
View SolutionHow many lines of symmetry does the above figure have ?
View SolutionWhich of the following are correct chain isomers of butane ? (i)
View SolutionDetermine the point of symmetry of a regular hexagon.
View SolutionDtermine the images of the following figure about the given line :
View SolutionMatch the following Column A to Column B

View SolutionMatch the following Column A to Column B

View SolutionMatch the following Column A to Column B

View SolutionFind the area of the figure given below.

View SolutionThe area of the shaded part in the figure given below is ______.

View SolutionThe inequation represented by the graph given below is :
View SolutionThe inequation that best describes the graph given below is _________
View SolutionThe inequation that best describes the following graph is _________
View SolutionWhich inequations represent the shaded region in the given figure
View Solutionकिसी विद्यालय के शिक्षकों के भार किलोग्राम में नीचे दिए गए हैं। इन्हें बारंबारता सारणी में प्रकट कीजिए:
65,62,61, 65,62,70,62,70,75,72,70,60, 80,85,63,85,67,80,75,65.
View Solution'A' is the portion of adenophypophysis which secrets different hormones 'A' is____
View Solution
