प्रिया की पास बुक का एक पृष्ठ नीचे दिया गया है :

जुलाई 2001 से 31 दिसंबर 2001 तक प्रिया द्वारा की गयी कुल लेन-देन ज्ञात कीजिये।
The correct Answer is:160 रु
Step by step video, text & image solution for प्रिया की पास बुक का एक पृष्ठ नीचे दिया गया है : जुलाई 2001 से 31 दिसंबर 2001 तक प्रिया द्वारा की गयी कुल लेन-देन ज्ञात कीजिये। by Maths experts to help you in doubts & scoring excellent marks in Class 9 exams.
Topper's Solved these Questions
- BOOK - S CHANDCHAPTER - बैंक प्रणाली EXERCISE - प्रश्नावली 14.29videos
बैंक प्रणाली
- BOOK - S CHANDCHAPTER - बैंक प्रणाली EXERCISE - प्रश्नावली 14.29videos
बैंक प्रणाली
- BOOK - S CHANDCHAPTER - बिन्दुपथEXERCISE - प्रश्नवली 22.210videos
बिन्दुपथ
- BOOK - S CHANDCHAPTER - लाभ तथा हानिEXERCISE - प्रश्नवाली 9.55videos
लाभ तथा हानि
Similar Questions
जॉन बैंक में 219 दिन के लिए 20,350 रु सविध खाते में जमा करता है। यदि ब्याज की दर 6.75% हो तथा ब्याज का संयोजन वार्षिक होता हो ,तो सविध राशि का ब्याज ज्ञात कीजिए।
03:39View Solutionजॉन बैंक में 219 दिन के लिए 20,350 रु सविध खाते में जमा करता है। यदि ब्याज की दर 6.75% हो तथा ब्याज का संयोजन वार्षिक होता हो ,तो सविध राशि का ब्याज ज्ञात कीजिए।
01:37View Solutionतीन प्रतिच्छेदी रेखाओं से कितने समदूरस्थ बिन्दु होते हैं?
06:07View Solutionएक घड़ी 12% लाभ पर बेची गई । यदि वह 33 रु. अधिक में बेची जाती, तो उसका लाभ 14% होता। घड़ी का क्रय मूल्य ज्ञात कीजिए ।
02:11View Solution
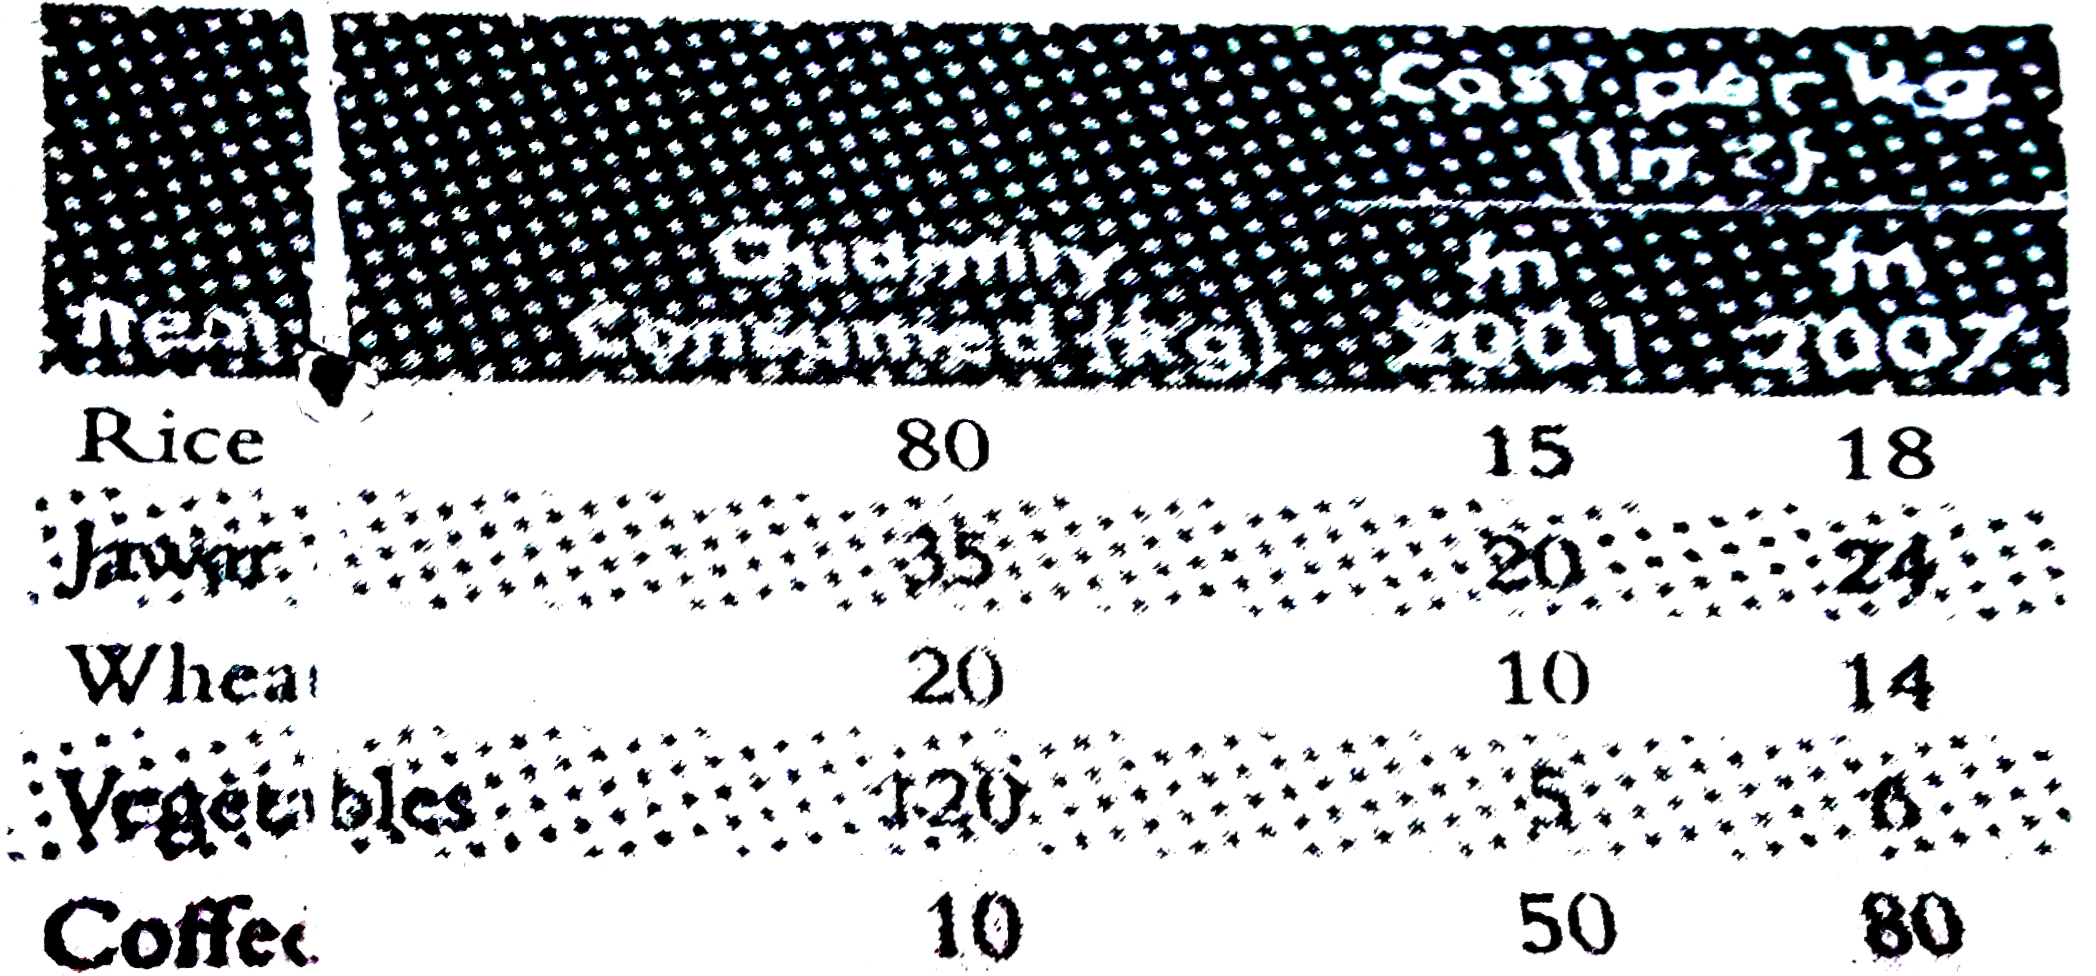
Find the cost of living index in the year 2007, taking 2001 as the base year, based on the information given above.01:31View SolutionHow many lines of symmetry does the above figure have ?
02:45View SolutionWhich of the following are correct chain isomers of butane ? (i)
02:17View SolutionDetermine the point of symmetry of a regular hexagon.
05:41View SolutionDtermine the images of the following figure about the given line :
02:21View SolutionMatch the following Column A to Column B
 02:03View Solution
Match the following Column A to Column B
 02:10View Solution
Match the following Column A to Column B
 02:17View Solution
Find the area of the figure given below.
 02:10View Solution
The area of the shaded part in the figure given below is ______.
 04:23View Solution
The inequation represented by the graph given below is :
03:12View SolutionThe inequation that best describes the graph given below is _________
05:46View Solution

