आयु (वर्षो में ) रोगियों की संख्या 10−20 6 20−30 12 30−40 28 40−50 18 50−60 10 60−70 4
उपरोक्त सारणी की सहायता से संचयी बारम्बारता सारणी बनाइए।
Step by step video & image solution for {:(" आयु (वर्षो में ) ","रोगियों की संख्या "),(" "10-20," "6),(" "20-30," "12),(" "30-40," "28),(" "40-50," "18),(" "50-60," "10),(" "60-70," "4):} उपरोक्त सारणी की सहायता से संचयी बारम्बारता सारणी बनाइए। by Maths experts to help you in doubts & scoring excellent marks in Class 9 exams.
Updated on:21/07/2023Topper's Solved these Questions
Similar Questions
सांख्यिकी के अर्थ एवं इसके कार्यक्षेत्र का वर्णन करें।
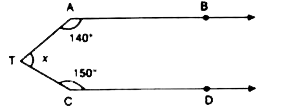
View Solutionआकृति में, AB∣∣CD हो, तो x का मान ज्ञात कीजिए

View Solutionएक धातु की गेंद को गर्म कर विभिन्न अंतरालों पर उसका तापमान ज्ञात किया , जैसा कि सरणी में दिखाया गया है :-

समय - ताप ग्राफ खींचिए और निम्न प्रश्नों का उत्तर दीजिए :-
समय t = 5 सेकंड पर गेंद का तापमान क्या है ?
View SolutionWrite the median class for the following frequency distribution: Class-interval: 0-10 10-20 20-30 30-40 40-50 50-60 60-70 70-80 Frequency: 5 8 7 12 28 20 10 10
View SolutionWrite the median class of the following distribution: Classes: 0-10 10-20 20-30 30-40 40-50 50-60 60-70 Frequency: 4 4 8 10 12 8 4
View SolutionThe following table gives the marks scored by 100 students in an entrance examination.

View Solutionनिम्न प्रेक्षण 18 छात्रों के गणित की परीक्षा में प्राप्तांकों को दर्शाते है, इनका माध्य ज्ञात कीजिए -
45, 40, 50, 40, 60, 40, 50, 50, 70, 30, 20, 70, 50, 45, 30, 20, 70, 70
View Solutionकिसी विधालय कि नवीं कक्षा के 30 विधार्थियों द्वारा (100 अंकों में से) प्राप्त अंक निम्नांकित हैं -
10, 20, 70, 60, 95, 40, 70, 50, 36, 60,
92, 88, 40, 36, 72, 60, 92, 80, 50, 40,
92, 40, 88, 60, 56, 70, 50, 36, 70, 56.
इन आँकड़ों की एक बारंबारता बंटन सारणी बनाएँ | सारणी देखकर बताएँ की कितने विधार्थियों को 92 अंक प्राप्त हुए |
View SolutionFind the polymer of the following table: {:("वर्गान्तर", 0-10, 10-20, 20-30, 30-40, 40-50, 50-60),("आवृत्ति", 9,17,28,23,15,8):}
View SolutionFind the median of the following table: {:("वर्गान्तर", 0-10, 10-20, 20-30, 30-40, 40-50, 50-60),("आवृत्ति", 4,6,10,7,3,2):}
View Solutionनिम्नलिखित सारणी का बहुलक ज्ञात कीजिए।
वर्ग0−1010−2020−3030−4040−5050−6060−70 आवृत्ति 8152040301412
View SolutionCalculate the median deviation from the median of the following data: Wages per week (in Rs.), 10-20, 20-30, 30-40, 40-50, 50-60, 60-70, 70-80 No. of workers, 4, 6, 10, 20, 10, 6, 4
View SolutionThe following table gives the marks scored by 100 students in an entrance examination. Marks: 0-10 10-20 20-30 30-40 40-50 50-60 60-70 70-80 No. of Students (Frequency): 4 10 16 22 20 18 8 2 Represent this data in the form of a histogram.
View SolutionCalculate the mean deviation from the median of the following data: Wages per week (in Rs.), 10-20, 20-30, 30-40, 40-50, 50-60, 60-70, 70-80 No. of workers, 4, 6, 10, 20, 10, 6, 4
View SolutionFind the mode of the following distribution: (i) Class-interval: 0-10 10-20 20-30 30-40 40-50 50-60 60-70 70-80 Frequency: 5 8 7 12 28 20 10 10
View Solution
