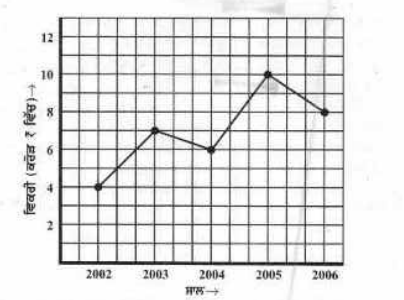
ਇੱਕ ਨਿਰਮਾਣ ਕੰਪਨੀ ਦੇ ਵੱਖ-ਵੱਖ ਸਾਲਾਂ ਵਿੱਚ ਕੀਤੀ ਗਈ ਵਿਕਰੀ ਹੇਠਾਂ ਦਿੱਤੇ ਗਰਾਫ਼ ਦੁਆਰਾ ਦਰਸਾਈ ਗਈ ਹੈ : ਕਿਸ ਅੰਤਰਾਲ ਵਿੱਚ ਵਿਕਰੀ ਦਾ ਇਹ ਅੰਤਰ ਸਭ ਤੋਂ ਜਿਆਦਾ ਸੀ?

Step by step video & image solution for ਇੱਕ ਨਿਰਮਾਣ ਕੰਪਨੀ ਦੇ ਵੱਖ-ਵੱਖ ਸਾਲਾਂ ਵਿੱਚ ਕੀਤੀ ਗਈ ਵਿਕਰੀ ਹੇਠਾਂ ਦਿੱਤੇ ਗਰਾਫ਼ ਦੁਆਰਾ ਦਰਸਾਈ ਗਈ ਹੈ : ਕਿਸ ਅੰਤਰਾਲ ਵਿੱਚ ਵਿਕਰੀ ਦਾ ਇਹ ਅੰਤਰ ਸਭ ਤੋਂ ਜਿਆਦਾ ਸੀ? by Maths experts to help you in doubts & scoring excellent marks in Class 8 exams.
Topper's Solved these Questions
Similar Questions
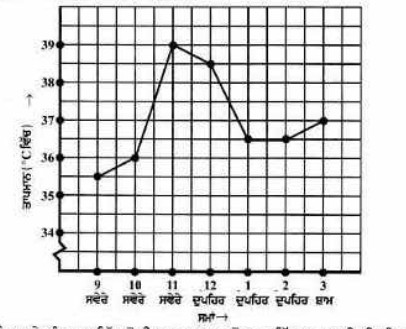
ਹੇਠਾਂ ਲਿਖੇ ਗਰਾਫ਼, ਕਿਸੇ ਹਸਪਤਾਲ ਵਿੱਚ ਇੱਕ ਰੋਗੀ ਦਾ ਪ੍ਰਤੀ ਘੰਟੇ ਲਿਆ ਗਿਆ ਤਾਪਮਾਨ ਦਰਸਾਉਂਦਾ ਹੈ : ਦੁਪਹਿਰ 1 ਵਜੇ ਰੋਗੀ ਦਾ ਤਾਪਮਾਨ ਕੀ ਸੀ?
 01:37View Solution
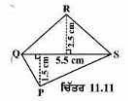
ਚਿੱਤਰ 11.11 ਵਿੱਚ ਦਰਸਾਏ ਗਏ ਚਤੁਰਭੁਜ PQRS ਦਾ ਖੇਤਰਫਲ ਪਤਾ ਕਰੋ।
 06:07View Solution
ਦਿੱਤੇ ਹੋਏ ਪਦਾਂ ਵਿੱਚ ਸਾਂਝਾ ਗੁਣਨਖੰਡ ਪਤਾ ਕਰੋ : 12x, 36
02:11View SolutionHow many lines of symmetry does the above figure have ?
01:31View SolutionWhich of the following are correct chain isomers of butane ? (i)
02:45View SolutionDetermine the point of symmetry of a regular hexagon.
02:17View SolutionDtermine the images of the following figure about the given line :
05:41View SolutionMatch the following Column A to Column B
 02:21View Solution
Match the following Column A to Column B
 02:03View Solution
Match the following Column A to Column B
 02:10View Solution
Find the area of the figure given below.
 02:17View Solution
The area of the shaded part in the figure given below is ______.
 02:10View Solution
The inequation represented by the graph given below is :
04:23View SolutionThe inequation that best describes the graph given below is _________
01:13View SolutionThe inequation that best describes the following graph is _________
03:12View SolutionWhich inequations represent the shaded region in the given figure
05:46View Solution

