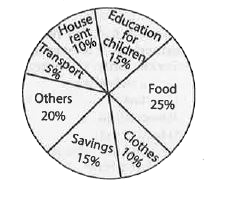
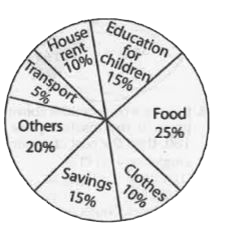
Adjoining pie chart gives the expenditure (in percentage) on various items and savings of a family during a month.
On which item the expenditure was mximum ?
 Solution in Punjabi
Step by step video & image solution for Adjoining pie chart gives the expenditure (in percentage) on various items and savings of a family during a month. On which item the expenditure was mximum ? by Maths experts to help you in doubts & scoring excellent marks in Class 8 exams.
Updated on:21/07/2023Topper's Solved these Questions
Similar Questions
Which of the following numbers are not perfect cubes : 216
View SolutionThe cost of 5 metres of a particular quality of cloth is Rs 210. Tabulate the cost of 2, 4, 10 and 13 metres of cloth of the same type.
View SolutionDetermine the point of symmetry of a regular hexagon.
View SolutionMatch the following Column A to Column B

View SolutionMatch the following Column A to Column B

View SolutionMatch the following Column A to Column B

View SolutionThe inequation represented by the graph given below is :
View SolutionMatch the items given in column A and B: ltimg src="https://d10lpgp6xz60nq.cloudfront.net/physics_images/NCERT_BIO_XII_C16_E01_004_Q01.png" width="80%"gt
View SolutionThe pie-chart gives the expenditure ( in percentage ) on various intems and saving of a family during a month. Monthly savings of the family is ₹ 3,000 On which item is the expenditure maxiumum and how much is it ?

View SolutionInstructions: The attached pie chart shows the expenditure and its savings (in percentage) in various items of the family throughout the month. Answer the following questions based on the pie chart.
View SolutionThe adjoining pie chart gives the expenditure on various Items during a month for a family. (The numbers written around the pie chart tell as the angles made by each sector at the centre). Answer the following : On which Item is the expenditure maximum ?
View SolutionThe pie - chart gives the expenditure (in percentage) on various items and savings of a family during a month. Monthly savings of the family is Rs 3, 000. On which item is the expenditure maximum and how much is it ?

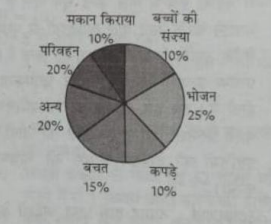
View Solutionसंलग्न पाई चार्ट एक महीने में एक परिवार के विभिन्न मर्दों में से व्यय और उसकी बचत ( प्रतिशतों में) दर्शाता है।

किसी मद a में व्यय सबसे अधिक था ?
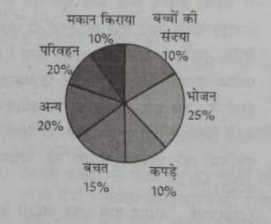
View Solutionसंलग्न पाई चार्ट एक महीने में एक परिवार के विभिन्न मर्दों में से व्यय और उसकी बचत ( प्रतिशतों में) दर्शाता है।

किसी मद पर हुआ व्यय परिवार की कुल बचत के बराबर है ?
View SolutionStudy the chart and answer the question based, on the pie chart. The pie chart given below shows expenditures incurred by a family on various items and savings in a month. Savings of the family is ₹ 8,000 in a month. What is the total expenditure of the family for the month ?
View SolutionStudy the chart and answer the question based, on the pie chart. The pie chart given below shows expenditures incurred by a family on various items and savings in a month. Savings of the family is ₹ 8,000 in a month. The ratio of the expenditure on food to the saving is :
View Solution

