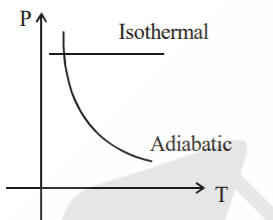
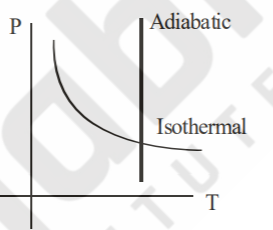
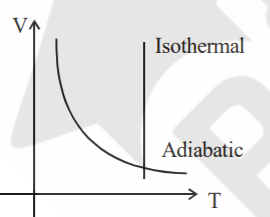
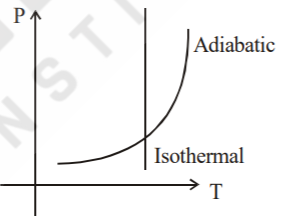
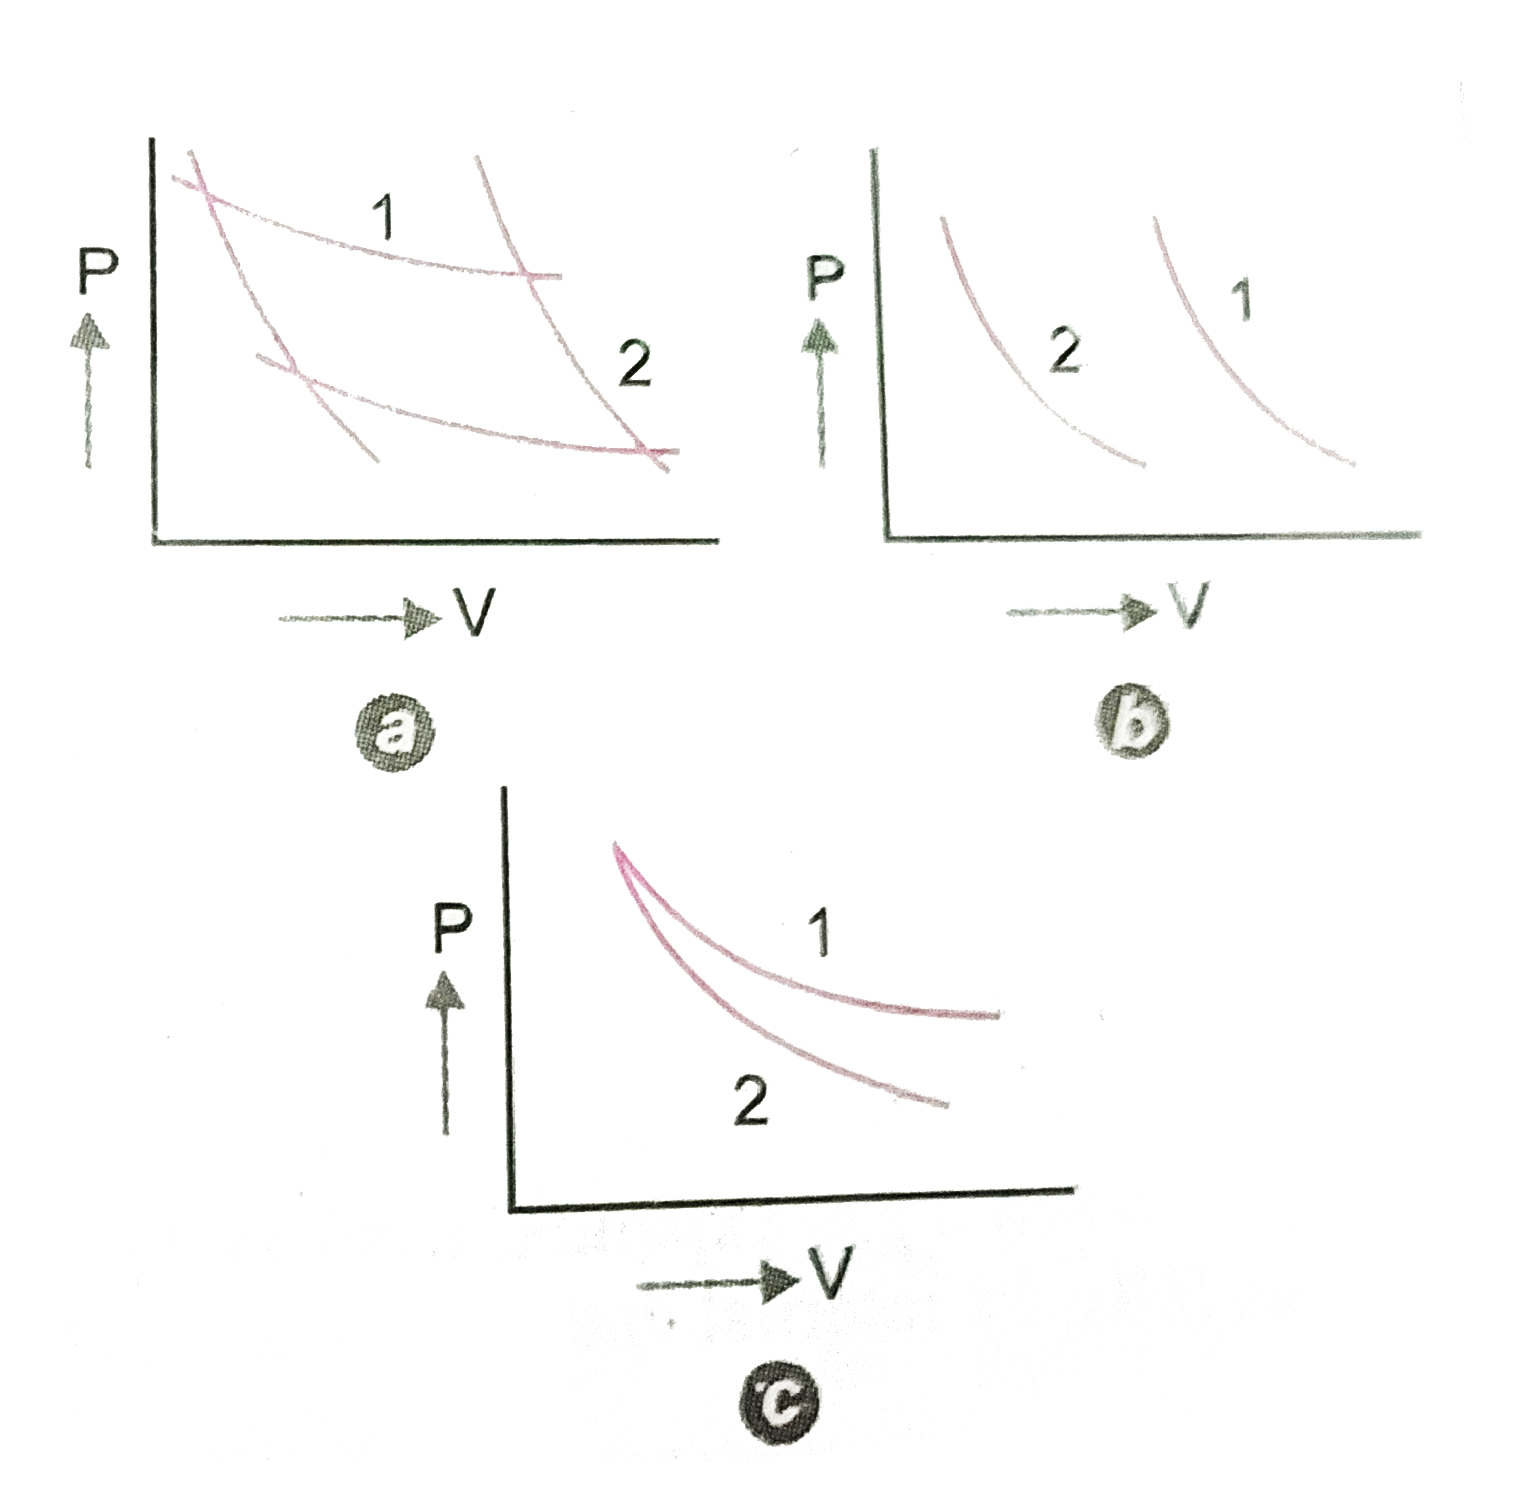
Sample of gases are taken through isothermal and adiabatic process. Choose which of the following diagram correctly represent isothermal and adiabatic process
The correct Answer is:D
To solve the problem of identifying the correct diagrams representing isothermal and adiabatic processes, we need to understand the characteristics of these two thermodynamic processes.
1. Understand Isothermal Process:
- In an isothermal process, the temperature (T) remains constant. This means that any heat added to the system is used to do work, and the internal energy of the system does not change.
- The relationship between pressure (P) and volume (V) for an ideal gas during an isothermal process is given by Boyle's Law: PV=constant.
2. Understand Adiabatic Process:
- In an adiabatic process, there is no heat exchange with the surroundings (Q = 0). The temperature of the gas changes as it expands or compresses.
- The relationship for an ideal gas during an adiabatic process is given by PVγ=constant, where γ (gamma) is the heat capacity ratio (C_p/C_v).
3. Analyzing the Graphs:
- Graph 1: Check if it represents an isothermal or adiabatic process. Since it shows constant pressure, it cannot represent an isothermal process (which should show a hyperbolic curve). Thus, this graph is incorrect.
- Graph 2: Analyze the temperature lines. If it shows a constant temperature line, it may represent an isothermal process. However, if it shows a constant pressure line, it is incorrect.
- Graph 3: Look for a hyperbolic curve indicating an isothermal process (constant temperature). If it shows a curve that decreases in pressure as volume increases, this could be correct.
- Graph 4: Similar to Graph 3, check if it shows a hyperbolic curve for isothermal and a steep curve for adiabatic. If it shows a straight line, it is incorrect.
4. Conclusion:
- After analyzing all graphs, identify which graph correctly represents the isothermal process (constant temperature) and which one represents the adiabatic process (no heat exchange).
- The correct answer will be the graph that shows the isothermal process as a hyperbolic curve and the adiabatic process as a steeper curve.
Final Answer:
- The correct representation for the isothermal and adiabatic processes is found in Option 4.
- In an isothermal process, the temperature (T) remains constant. This means that any heat added to the system is used to do work, and the internal energy of the system does not change.
- The relationship between pressure (P) and volume (V) for an ideal gas during an isothermal process is given by Boyle's Law: PV=constant.
- In an adiabatic process, there is no heat exchange with the surroundings (Q = 0). The temperature of the gas changes as it expands or compresses.
- The relationship for an ideal gas during an adiabatic process is given by PVγ=constant, where γ (gamma) is the heat capacity ratio (C_p/C_v).
- Graph 1: Check if it represents an isothermal or adiabatic process. Since it shows constant pressure, it cannot represent an isothermal process (which should show a hyperbolic curve). Thus, this graph is incorrect.
- Graph 2: Analyze the temperature lines. If it shows a constant temperature line, it may represent an isothermal process. However, if it shows a constant pressure line, it is incorrect.
- Graph 3: Look for a hyperbolic curve indicating an isothermal process (constant temperature). If it shows a curve that decreases in pressure as volume increases, this could be correct.
- Graph 4: Similar to Graph 3, check if it shows a hyperbolic curve for isothermal and a steep curve for adiabatic. If it shows a straight line, it is incorrect.
- After analyzing all graphs, identify which graph correctly represents the isothermal process (constant temperature) and which one represents the adiabatic process (no heat exchange).
- The correct answer will be the graph that shows the isothermal process as a hyperbolic curve and the adiabatic process as a steeper curve.
- The correct representation for the isothermal and adiabatic processes is found in Option 4.
Topper's Solved these Questions
- BOOK - JEE MAINS PREVIOUS YEARCHAPTER - JEE MAIN 2021EXERCISE - SECTION-A80videos
JEE MAIN 2021
- BOOK - JEE MAINS PREVIOUS YEARCHAPTER - JEE MAIN 2021EXERCISE - SECTION-B40videos
JEE MAIN 2021
- BOOK - JEE MAINS PREVIOUS YEARCHAPTER - JEE MAINEXERCISE - All Questions473videos
JEE MAIN
- BOOK - JEE MAINS PREVIOUS YEARCHAPTER - JEE MAIN 2022EXERCISE - Question492videos
JEE MAIN 2022
Similar Questions
Knowledge Check
- Question 1 - Select One
for an adiabatic process , which of the following is correct ?
APΔV=0Bq=+WCΔq=0DΔE=q - Question 2 - Select One
Which of the following P−V diagrams best represents an isothermal process?
A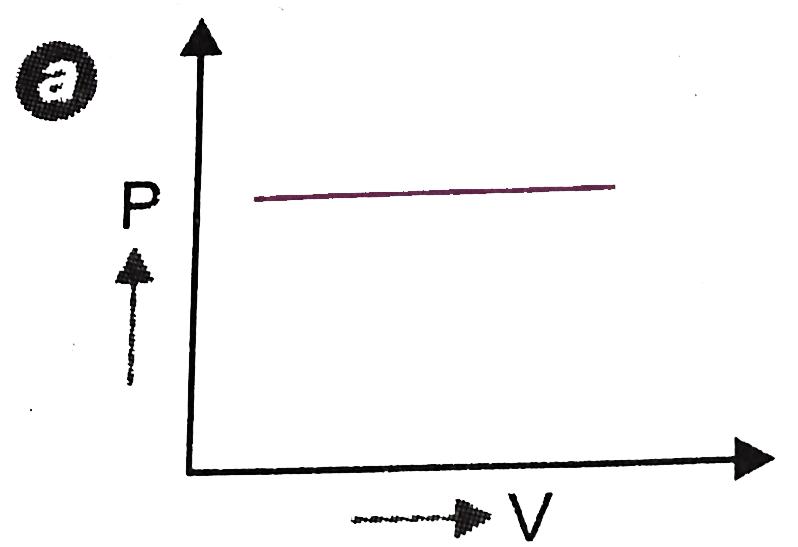 B
B C
C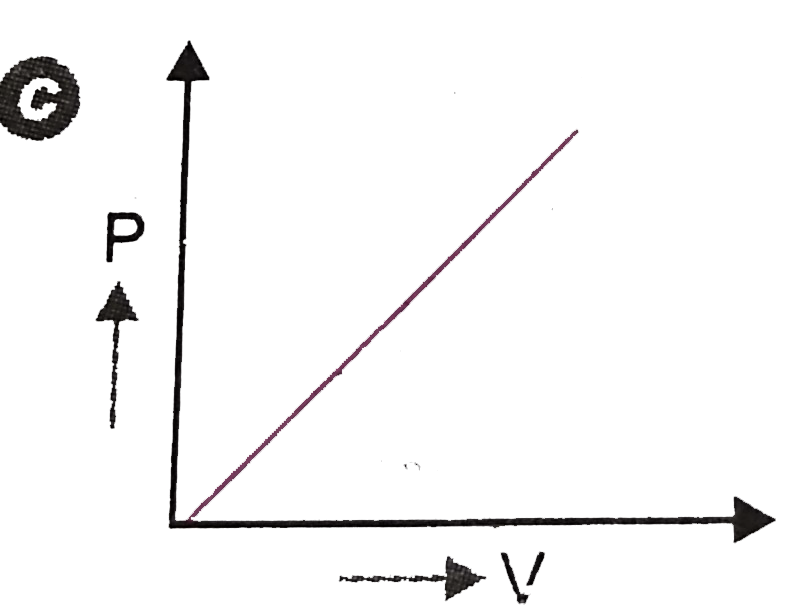 D
D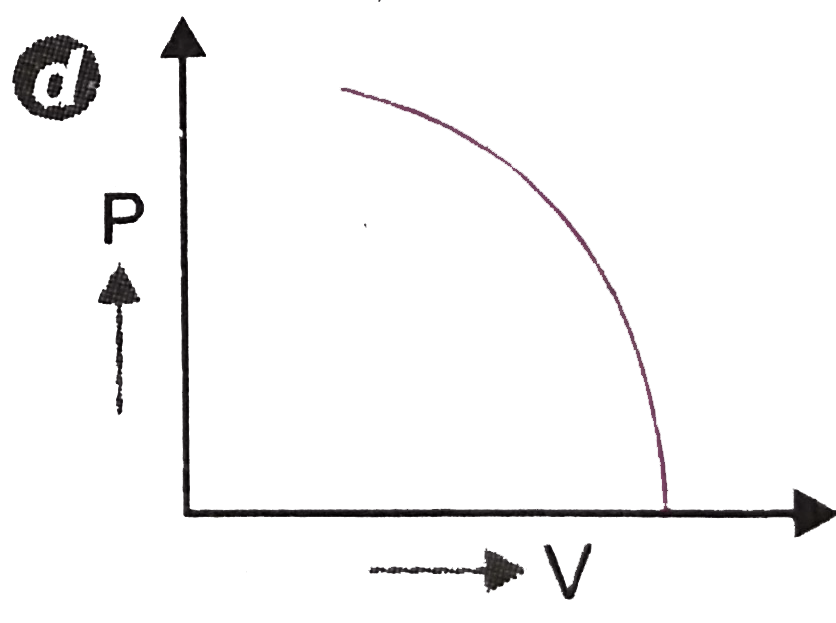
- Question 3 - Select One
Which of the following p-V diagrams best represents an isothermal process ?
A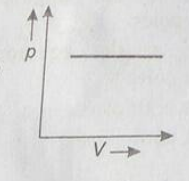 B
B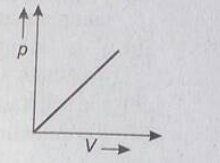 C
C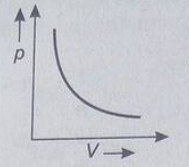 D
D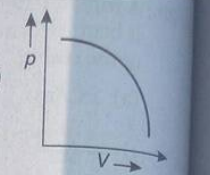
Identify isothermal and adiabatic process in the following diagram
 View Solution
Isothermal and adiabatic process are identical.
View SolutionIsothermal Process and Adiabatic Process.
View SolutionAnalysis OF Isothermal and Adiabatic Process
View SolutionWhich of the following p-V diagrams best represents an isothermal process ?
View Solution

