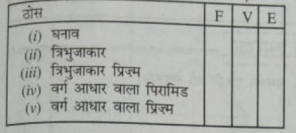
निम्नलिखित बहफलकों के लिए फलकों, किनारों और शीर्षों की संख्याओं को सारणीबद्ध कीजिए ।

The correct Answer is:घनाभ : F=6, V=8, E= 12
त्रिभुजाकार पिरामिड : F=4, V=4, E=6
त्रिभुजाकार प्रिज्म : F=5, V=6, E=9
वर्ग आधार वाला पिरामिड : F=5, V=D=5, E=8
वर्ग आधार वाला प्रिज्म : F=6, V=8, E=12
Step by step video, text & image solution for निम्नलिखित बहफलकों के लिए फलकों, किनारों और शीर्षों की संख्याओं को सारणीबद्ध कीजिए । by Maths experts to help you in doubts & scoring excellent marks in Class 8 exams.
Topper's Solved these Questions
- BOOK - STUDENTS FRIENDSCHAPTER - ठोस आकारों का चित्रण EXERCISE - EXERCISE 13.3 (लघु उत्तरीय प्रश्न) Type II1videos
ठोस आकारों का चित्रण
- BOOK - STUDENTS FRIENDSCHAPTER - चतुर्भुजों को समझना EXERCISE - EXERCISE 11.3 (दीर्घ उत्तरीय प्रश्न)14videos
चतुर्भुजों को समझना
- BOOK - STUDENTS FRIENDSCHAPTER - ठोस आकृतियों के पृष्ठीय क्षेत्रफल तथा आयतन EXERCISE - EXERCISE 15.418videos
ठोस आकृतियों के पृष्ठीय क्षेत्रफल तथा आयतन
Similar Questions
पिरामिड और शंकु किस प्रकार एक जैसे हैं ?
01:37View Solutionकिसी समान्तर चतुर्भुज के दो आसन्न कोणों का अनुपात 3:2 है। समान्तर चतुर्भुज के सभी कोणों की माप ज्ञात कीजिए।
06:07View Solutionएक लम्ब वृत्तीय बेलन की ऊँचाई 7m तथा आधार का व्यास 10 m है तो बेलन का आयतन ........... m3 होगा।
02:11View SolutionHow many lines of symmetry does the above figure have ?
01:31View SolutionWhich of the following are correct chain isomers of butane ? (i)
02:45View SolutionDetermine the point of symmetry of a regular hexagon.
02:17View SolutionDtermine the images of the following figure about the given line :
05:41View SolutionMatch the following Column A to Column B
 02:21View Solution
Match the following Column A to Column B
 02:03View Solution
Match the following Column A to Column B
 02:10View Solution
Find the area of the figure given below.
 02:17View Solution
The area of the shaded part in the figure given below is ______.
 02:10View Solution
The inequation represented by the graph given below is :
04:23View SolutionThe inequation that best describes the graph given below is _________
01:13View SolutionThe inequation that best describes the following graph is _________
03:12View SolutionWhich inequations represent the shaded region in the given figure
05:46View Solution

