एक वर्ष तक के मियादी जमा पर विभिन्न वर्षों में बैंक के परिवर्तित ब्याज दर को निम्नांकित सारणी में दिया गया है। इन आंकड़ों के लिए आलेख खींचे।

Step by step video & image solution for एक वर्ष तक के मियादी जमा पर विभिन्न वर्षों में बैंक के परिवर्तित ब्याज दर को निम्नांकित सारणी में दिया गया है। इन आंकड़ों के लिए आलेख खींचे। by Maths experts to help you in doubts & scoring excellent marks in Class 8 exams.
Updated on:21/07/2023Topper's Solved these Questions
- आलेखों से परिचय BOOK - STUDENTS FRIENDSCHAPTER - आलेखों से परिचय EXERCISE - EXERCISE 16.2 (अतिलघु उत्तरीय प्रश्न)
3 Videos
- आँकड़ों का प्रबंधनBOOK - STUDENTS FRIENDSCHAPTER - आँकड़ों का प्रबंधनEXERCISE - EXERCISE 17.3 (Type II.)
9 Videos
- एक चर वाले रैखिक समीकरण BOOK - STUDENTS FRIENDSCHAPTER - एक चर वाले रैखिक समीकरण EXERCISE - EXERCISE 8.2 (दीर्घ उत्तरीय प्रश्न) (Type V विविध प्रश्न)
12 Videos
Similar Questions
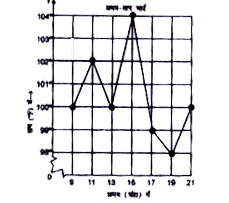
एक मरीज के एक दिन का तापमान निम्नांकित आलेख में दिखाया गया है।

आलेख को देखकर निम्नांकित प्रश्नों के उत्तर दें।
(i) रोगी का तापमान 11 बजे कितना है? (ii) रोगी का तापमान 15 बजे कितना है?
(iii) किस समय ताप अधिकतम है ?
(iv) किस समय ताप न्यूनतम है ?
(v) 100°F ताप किस समय है?
(vi) आलेख द्वारा प्रदर्शित विवरण को सारणी रूप में लिखें।
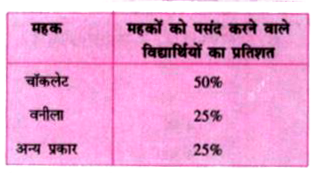
View Solutionकिसी स्कूल के विद्यार्थियों द्वारा पसंद किए जाने वाली आइसक्रीमों की महक या स्वाद (प्रतिशतों में) नीचे दिए गए हैं :

इन आँकड़ों को एक पाई चार्ट के रूप में निरूपित करें।
View Solutionएक खेत को 14 दिन में जोता जा सकता है। यदि नित्य 20 हेक्टेयर भूमि अधिक जोती जाए तो पूरा काम 10 दिन में समाप्त हो जाता है। खेत का क्षेत्रफल तथा नित्य जोती गई भूमि का क्षेत्रफल ज्ञात करें।
View SolutionHow many lines of symmetry does the above figure have ?
View SolutionWhich of the following are correct chain isomers of butane ? (i)
View SolutionDetermine the point of symmetry of a regular hexagon.
View SolutionDtermine the images of the following figure about the given line :
View SolutionMatch the following Column A to Column B

View SolutionMatch the following Column A to Column B

View SolutionMatch the following Column A to Column B

View SolutionThe inequation represented by the graph given below is :
View SolutionThe inequation that best describes the graph given below is _________
View SolutionThe inequation that best describes the following graph is _________
View SolutionWhich inequations represent the shaded region in the given figure
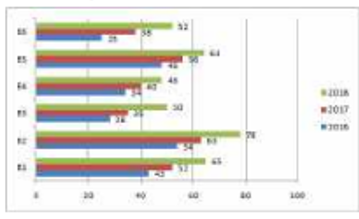
View SolutionThe following graph shows the data of the collection of interest on loans (in crore Rs) by six branches B1, B2, B3, B4, B5 and B6 of a bank during the years mentioned. Based on the information, from the year 2016 to 2017, the highest rate of collection is for the branch:
निम्नलिखित आरेख में उल्लिखित वर्षों के दौरान बैंक की छह शाखाओं B1, B2, B3, B4, B5 और B6 द्वारा ऋणों पर ब्याज (करोड़ रुपये में) के संग्रह के आंकड़ों का उल्लेख किया गया है।
जानकारी के आधार पर, वर्ष 2016 से 2017 तक, संग्रह की उच्चतम दर किस शाखा के लिए है?
View Solution'A' is the portion of adenophypophysis which secrets different hormones 'A' is____
View Solution
