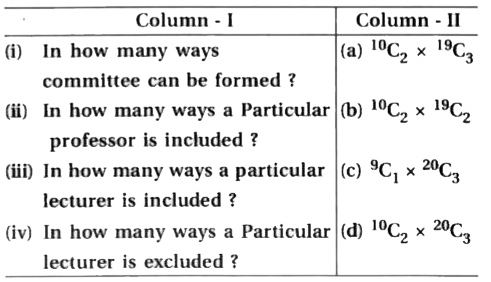
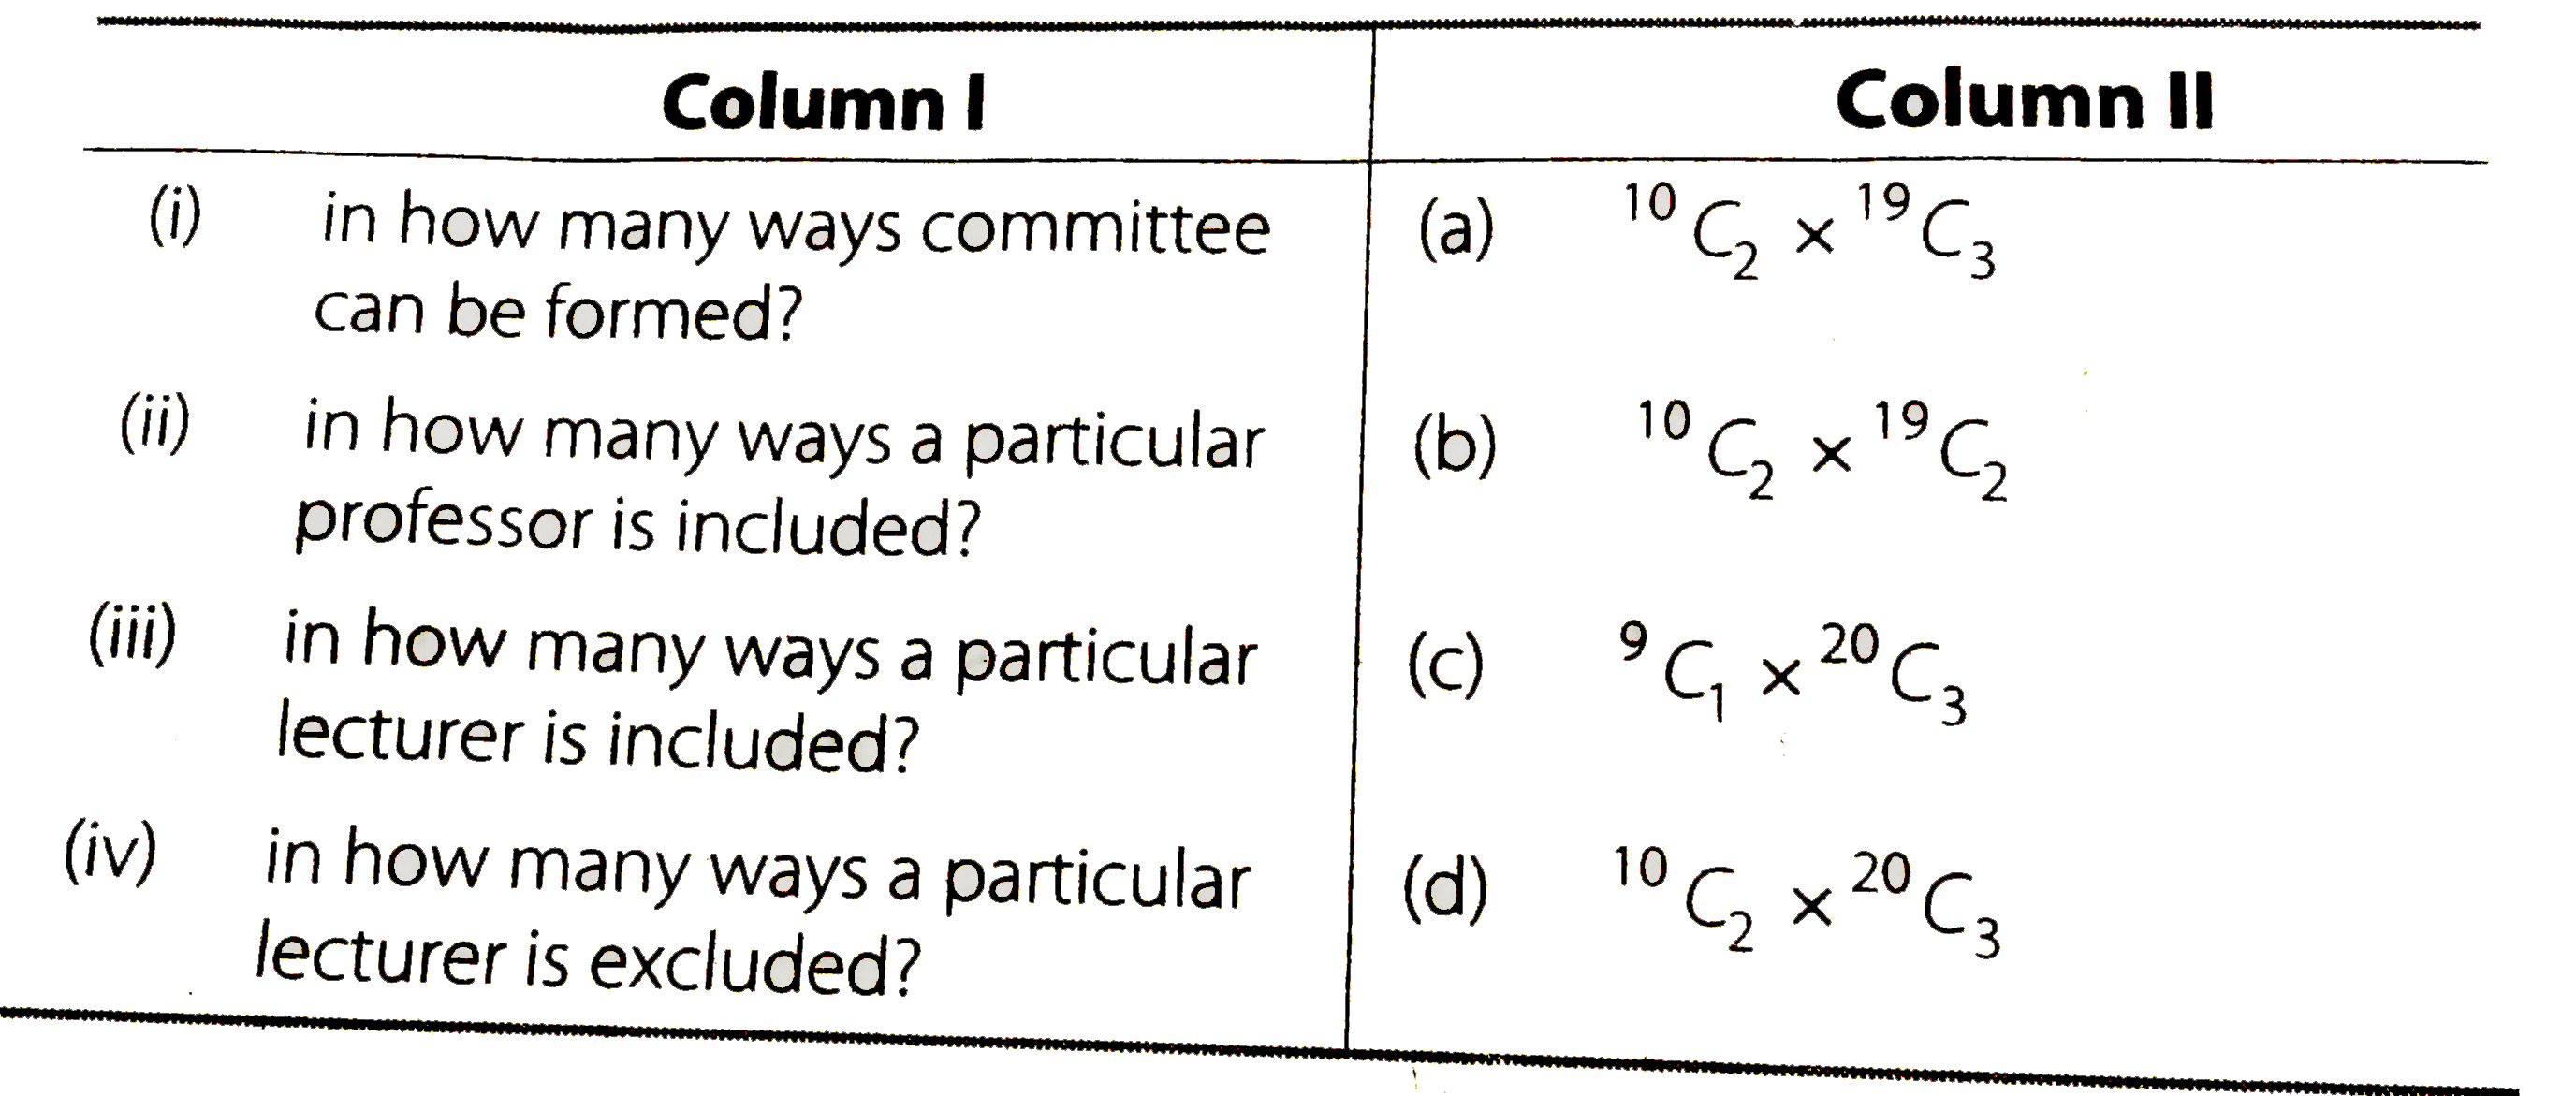
There are 10 professors and 20 lecturers, Out of whom a committee of 2 professors and 3 lecturers is to be formed, find
 Solution in Gujrati
Step by step video & image solution for There are 10 professors and 20 lecturers, Out of whom a committee of 2 professors and 3 lecturers is to be formed, find by Maths experts to help you in doubts & scoring excellent marks in Class 11 exams.
Updated on:21/07/2023Topper's Solved these Questions
- PERMUTATIONS AND COMBINATIONSBOOK - KUMAR PRAKASHANCHAPTER - PERMUTATIONS AND COMBINATIONSEXERCISE - PRACTICE WORK
40 Videos
- PERMUTATIONS AND COMBINATIONSBOOK - KUMAR PRAKASHANCHAPTER - PERMUTATIONS AND COMBINATIONSEXERCISE - NCERT EXEMPLAR PROBLEMS (TRUE / FALSE )
9 Videos
- OBJECTIVE SECTION AS PER NEW PAPER SCHEME BOOK - KUMAR PRAKASHANCHAPTER - OBJECTIVE SECTION AS PER NEW PAPER SCHEME EXERCISE - Sequence and Series (Fill in the blanks )
48 Videos
- PRINCIPLE OF MATHEMATICAL INDUCTIONBOOK - KUMAR PRAKASHANCHAPTER - PRINCIPLE OF MATHEMATICAL INDUCTIONEXERCISE - NCERT EXEMPLAR PROBLEMS (QUESTION OF MODULE )
11 Videos
Similar Questions
How many 4-digit number can be formed with the digit 1, 2, 3, 4, 6 and 8 if repetition of digits is not allowed.
View SolutionThere are 12 points in a plane of which 5 points are collinear, then the number of lines obtained by joining these points in pair is 12C2−5C2+1,
View Solution.......... is the 20th term of sequence an=(n−1)(2−n)(n−3).
View SolutionBy using the principle of mathematical induction , prove the follwing :
P(n)+1+3+5+……….+(2n−1)=n2,n∈N
View SolutionThere are 10 professors and 20 lecturers, out of whom a committee of 2 professors and 3 lecturers is to be formed. Find

View SolutionDetermine the point of symmetry of a regular hexagon.
View SolutionMatch the following Column A to Column B

View SolutionMatch the following Column A to Column B

View SolutionMatch the following Column A to Column B

View SolutionFind the area of the figure given below.

View SolutionThe inequation represented by the graph given below is :
View SolutionThe inequation that best describes the graph given below is _________
View SolutionThe inequation that best describes the following graph is _________
View SolutionIn Fig, find the value of x.
ltimg src="https://d10lpgp6xz60nq.cloudfront.net/physics_images/PS_MATH_IX_C12_S01_032_Q01.png" width="80%"gt
View SolutionIn the given fig. If DE||BC Find EC.
ltimg src="https://d10lpgp6xz60nq.cloudfront.net/physics_images/MATH_241_X_SQP_E01_021_Q01.png" width="80%"gt
View Solution
