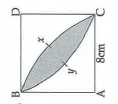
In the adjoining figure, arc BXC and arc BYC are drawn with radius 8 cm and centres as point A and D respectively. Find the area of shaded region if □ABCD is a square with side 8 cm.
 Solution in Marathi
Step by step video & image solution for In the adjoining figure, arc BXC and arc BYC are drawn with radius 8 cm and centres as point A and D respectively. Find the area of shaded region if squareABCD is a square with side 8 cm. by Maths experts to help you in doubts & scoring excellent marks in Class 10 exams.
Updated on:21/07/2023Topper's Solved these Questions
Similar Questions
To draw graph of 4x+5y=19,find y when x=1. Options: a) 4 b) 3 c) 2 d) -3
View SolutionWhat is the ratio of 1mm to 1cm?
View SolutionDetermine the point of symmetry of a regular hexagon.
View SolutionFind the area of the shaded region, given that the radius of each circle is equal to 5 cm.
View SolutionMatch the following Column A to Column B

View SolutionMatch the following Column A to Column B

View SolutionMatch the following Column A to Column B

View SolutionFind the area of figure given below.

View SolutionFind the area of the figure given below.

View SolutionThe area of the shaded part in the figure given below is ______.

View SolutionIn the figure given below, ABCD is a rectangle.ED = 16 cm, BF = 20 cm, and FG = FC = 8 cm, and FG is perpendicular to BC. If CD is half of AD, then find the area of the shaded region (in cm2).
ltimg src="https://d10lpgp6xz60nq.cloudfront.net/physics_images/PS_MATH_VII_C06_E06_006_Q01.png" width="80%"gt
View SolutionIn the adjoining figure, PQRS is a square of side 14 cm and two semicircle are drawn inside of it with PQ and SR as diameters. Find the area of the shaded region in the figure (in cm2).
ltimg src="https://d10lpgp6xz60nq.cloudfront.net/physics_images/PS_MATH_VII_C06_E07_008_Q01.png" width="80%"gt
View SolutionIn the adjoining figure, ABCD is a square of side 7 cm and two semicircles are drawn inside of it with AB and CD as diameters. Find the area of the shaded region (in cm2).
ltimg src="https://d10lpgp6xz60nq.cloudfront.net/physics_images/PS_MATH_VII_C06_E08_008_Q01.png" width="80%"gt
View SolutionThe inequation represented by the graph given below is :
View SolutionThe inequation that best describes the graph given below is _________
View SolutionThe inequation that best describes the following graph is _________
View Solution
