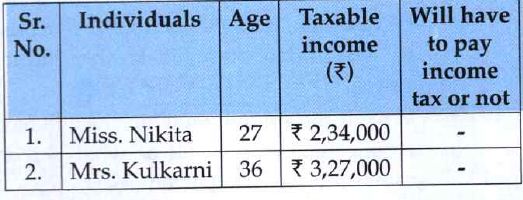
Observe the table given below. Check and decide whether the individuals have to pay income tax.
 Solution in Marathi
Step by step video & image solution for Observe the table given below. Check and decide whether the individuals have to pay income tax. by Maths experts to help you in doubts & scoring excellent marks in Class 9 exams.
Updated on:21/07/2023Topper's Solved these Questions
- FINANCIAL PLANNINGBOOK - CHETANA PUBLICATIONCHAPTER - FINANCIAL PLANNINGEXERCISE - Exercise
34 Videos
- CREATIVE QUESTIONSBOOK - CHETANA PUBLICATIONCHAPTER - CREATIVE QUESTIONSEXERCISE - Example
47 Videos
- LINEAR EQUATIONS IN TWO VARIABLESBOOK - CHETANA PUBLICATIONCHAPTER - LINEAR EQUATIONS IN TWO VARIABLESEXERCISE - Exercise
19 Videos
Similar Questions
For different types of investments wha is the maximum permissible amount under section 80 C of income tax?
View SolutionDraw only Venn diagram as per given information: A TV survey says 136 students watch only programme P1, 107 watch only programme P2, 27 watch only programme P3, 25 students watch P1 and P2 but not P3. 37 watch P2 and P3 but not P1, 53 students watch P1 and P3 but not P2, 40 students watch all three programmes and 80 students do not watch any programme.
View SolutionFrame linear equations in two variables representing the given information.Differenve between two complementary angles is 6.
View SolutionHow many lines of symmetry does the above figure have ?
View SolutionDetermine the point of symmetry of a regular hexagon.
View SolutionDtermine the images of the following figure about the given line :
View SolutionMatch the following Column A to Column B

View SolutionMatch the following Column A to Column B

View SolutionMatch the following Column A to Column B

View SolutionFind the area of figure given below.

View SolutionFind the perimeter of the figure given below.

View SolutionFind the area of the figure given below.

View SolutionThe area of the shaded part in the figure given below is ______.

View SolutionThe inequation represented by the graph given below is :
View SolutionThe inequation that best describes the graph given below is _________
View SolutionThe inequation that best describes the following graph is _________
View Solution
