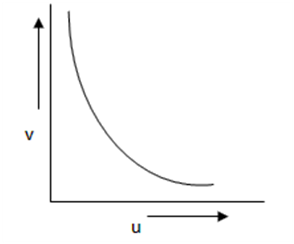
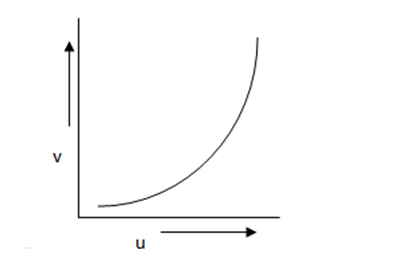
In an experiment to find focal length of a concave mirror, a graph is drawn between the magnitudes of (u) and (v). The graph looks like.
a) 
b) 
c) 
d) 
The correct Answer is:C
To determine the correct graph representing the relationship between the magnitudes of u (object distance) and v (image distance) in an experiment to find the focal length of a concave mirror, we can follow these steps:
1. Understand the Mirror Formula:
The focal length f of a concave mirror is given by the mirror formula:
1f=1v+1u
2. Rearranging the Formula:
Rearranging the formula to express 1u:
1u=1f−1v
3. Differentiate the Equation:
To find the relationship between u and v, we differentiate the rearranged equation:
−duu2=−dvv2
4. Express the Slope:
Rearranging gives us:
dvdu=−v2u2
This indicates that the slope dvdu is negative, meaning that as u increases, v decreases.
5. Analyze the Graph Options:
Since the slope dvdu is negative, we look for graphs that show a decreasing trend. Options B and C both show decreasing slopes.
6. Determine the Nature of the Graph:
The derived equation dvdu=−v2u2 suggests a non-linear relationship, indicating that the graph cannot be a straight line. Thus, we reject option B, which shows a straight line.
7. Select the Correct Option:
Option C, which shows an exponentially decreasing curve, is the correct representation of the relationship between the magnitudes of u and v.
Conclusion:
The correct graph representing the relationship between the magnitudes of u and v in the experiment is option C.
---
The focal length f of a concave mirror is given by the mirror formula:
1f=1v+1u
Rearranging the formula to express 1u:
1u=1f−1v
To find the relationship between u and v, we differentiate the rearranged equation:
−duu2=−dvv2
Rearranging gives us:
dvdu=−v2u2
This indicates that the slope dvdu is negative, meaning that as u increases, v decreases.
Since the slope dvdu is negative, we look for graphs that show a decreasing trend. Options B and C both show decreasing slopes.
The derived equation dvdu=−v2u2 suggests a non-linear relationship, indicating that the graph cannot be a straight line. Thus, we reject option B, which shows a straight line.
Option C, which shows an exponentially decreasing curve, is the correct representation of the relationship between the magnitudes of u and v.
The correct graph representing the relationship between the magnitudes of u and v in the experiment is option C.
Topper's Solved these Questions
- EXPERIMENTSBOOK - DC PANDEY ENGLISHCHAPTER - EXPERIMENTSEXERCISE - Subjective
15 Videos
- EXPERIMENTSBOOK - DC PANDEY ENGLISHCHAPTER - EXPERIMENTSEXERCISE - Exercise 3.8
3 Videos
- ELECTROSTATICSBOOK - DC PANDEY ENGLISHCHAPTER - ELECTROSTATICSEXERCISE - Integer
17 Videos
- FLUID MECHANICSBOOK - DC PANDEY ENGLISHCHAPTER - FLUID MECHANICSEXERCISE - Medical entranes gallery
49 Videos
Similar Questions
Focal length of a concave mirror is
View SolutionIn the experiment to determine the focal length of a concave mirror by graphical methods the u - v graph is
View SolutionWhat is the focal length of a concave mirror of radius of curvature 16.0 cm?
View SolutionThe focal length of a concave mirror is 10 cm. Find its radius of curvature.
View SolutionIn an experiment to measure the focal length of a concave mirror. If was found that for an object distance of 0.30 m, the image distance come out to be 0.60 m. Let us determine the focal length.
View SolutionIn u−v method to find focal length of a concave mirror, if object distance is found to be 10.0cm and image distance was also found to be 10.0cm, then find maximum permissible error in (f).
View SolutionThe graph between 1v and 1u for a concave mirror looks like.
View SolutionThe graph between 1v and 1u for a concave mirror looks like.
View SolutionAn object is placed midway between a concave mirror of focal length f and a convex mirror of focal length f. The distance between the two mirrors is 6f. Trace the ray that is first incident on the concave mirror and then the convex mirror.
View SolutionFor a concave mirrorr, if real image is formed the graph between 1u and 1v is of the form
View Solution
