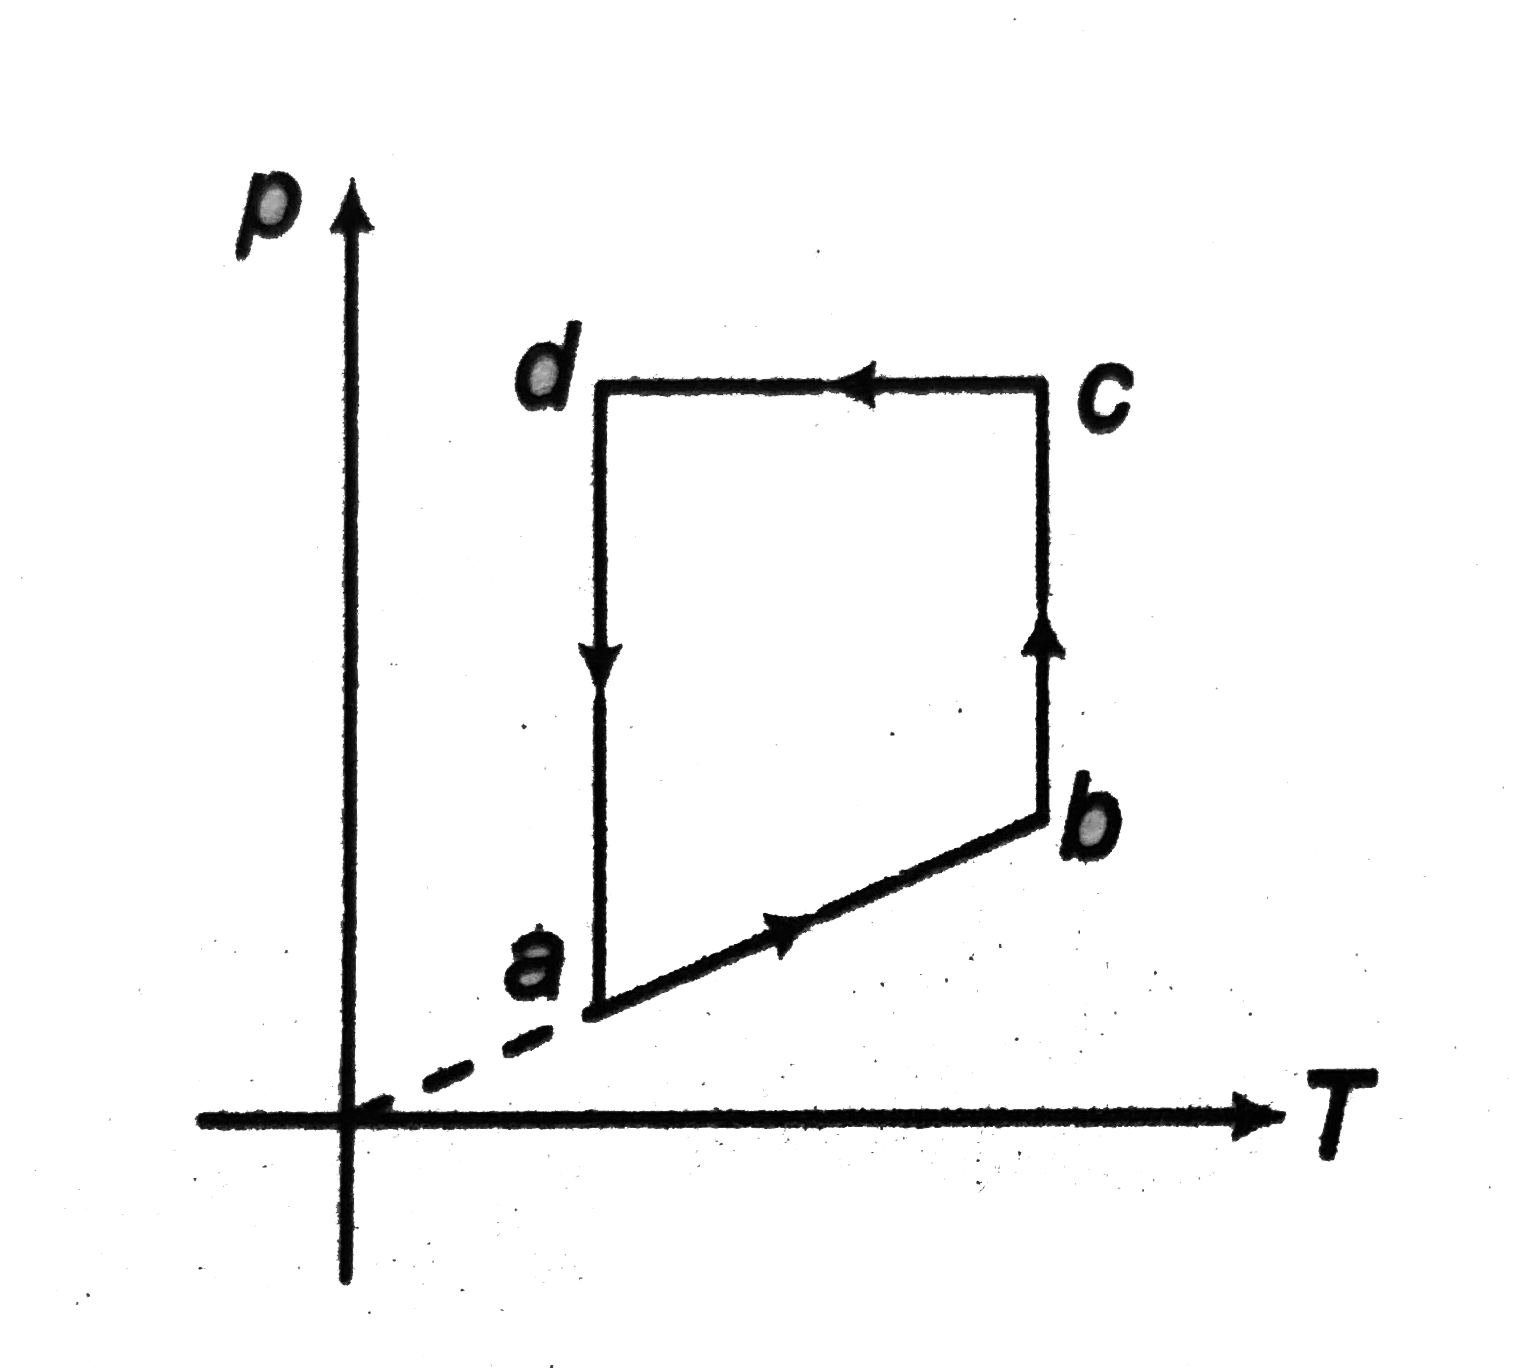
Corresponding to (p - T) graph as shown in figure, draw
(a) P - V graph
(b) V - T graph
( c) ρ - T graph and
(d) U - T graph.
Video Solution
Text Solution
The correct Answer is:A
(ab process) From the given graph, we can see that
(p∝T)
⇒(V=constant)(isochoric)<br>or(rho = "constant") (as ρ∝1v)
(p) and (T) both are increasing.
Therefore, U is also increasing ( as u∝T)
Now,
(i) (p - V) graph is straight line parallel to (p - axis) as (V) is constant.
(ii) (V - T) graph is a straight line parallel to (T - axis) as (V) is constant.
(iii) (p - T) graph is a straight line parallel to (T - axis) as (rho) is constant.
(iv) (U - T) graph is a straight line passing through origin as (U∝T).
(bc process) From the given graph, we can see that
(T = constant) (isothermal)
rArr (U = constant)
⇒(pV=constant)
or p∝1V
(p) is increasing. Therefore, (V) will decrease.
Hence, (ρ) will increase.
now,
(i) (p - V) graph is a rectangular hyperbola ( as P prop 1/V).
(ii) (V−T) graph is a straight line parallel to (V - axis), as (T= constant)
(iii) (ρ−T) graph is a striaght line parallel to ( rho - axis), as (T = constant)
(iv) ( U - T) graph is a dot, as (U) and (T) both are constants.
(cd process) From the given graph, we can see that
( p = constant)
rArr ( V prop T) (isobaric)
Temperature is decreasing. So, volume will also decrease. But density will increase.
Now,
(i) (p - V) graph is a straight line parallel to (V - axis) because (p) is constant.
(ii) (V - T) graph is a straight line passing through origin, as ( V prop T).
Now,
(i) (p - V) graph is a straight line parallel to (V - axis) because (p) is constant.
(ii) (V - T) graph is a straight line passing through origin, as ( V prop T).
(iii) ρ=pMRT⇒ρ∝1T as (p), (M) and (R) al are constants. Hence, (ρ−T) graph is rectangular hyperbola.
(iv) (U - T) graph is a straight line passing through origin as (U∝T).
(da process) This process is just inverse of (bc) process. So, this process will complete the cycle following the steps discussed in process (bc).
The four graphs are as shown below.
(##DCP_V03_C20_S01_024_S01##).
|
Topper's Solved these Questions
- THERMOMETRY,THERMAL EXPANSION & KINETIC THEORY OF GASESBOOK - DC PANDEY ENGLISHCHAPTER - THERMOMETRY,THERMAL EXPANSION & KINETIC THEORY OF GASESEXERCISE - Example Type 2
1 Videos
- THERMOMETRY,THERMAL EXPANSION & KINETIC THEORY OF GASESBOOK - DC PANDEY ENGLISHCHAPTER - THERMOMETRY,THERMAL EXPANSION & KINETIC THEORY OF GASESEXERCISE - Example Type 3
2 Videos
- THERMOMETRY,THERMAL EXPANSION & KINETIC THEORY OF GASESBOOK - DC PANDEY ENGLISHCHAPTER - THERMOMETRY,THERMAL EXPANSION & KINETIC THEORY OF GASESEXERCISE - Level 2 Subjective
9 Videos
- THERMOMETRY THERMAL EXPANSION AND KINETIC THEORY OF GASESBOOK - DC PANDEY ENGLISHCHAPTER - THERMOMETRY THERMAL EXPANSION AND KINETIC THEORY OF GASESEXERCISE - Medical entrance gallary
30 Videos
- UNIT AND DIMENSIONSBOOK - DC PANDEY ENGLISHCHAPTER - UNIT AND DIMENSIONSEXERCISE - Assertion And Reason
2 Videos
Similar Questions
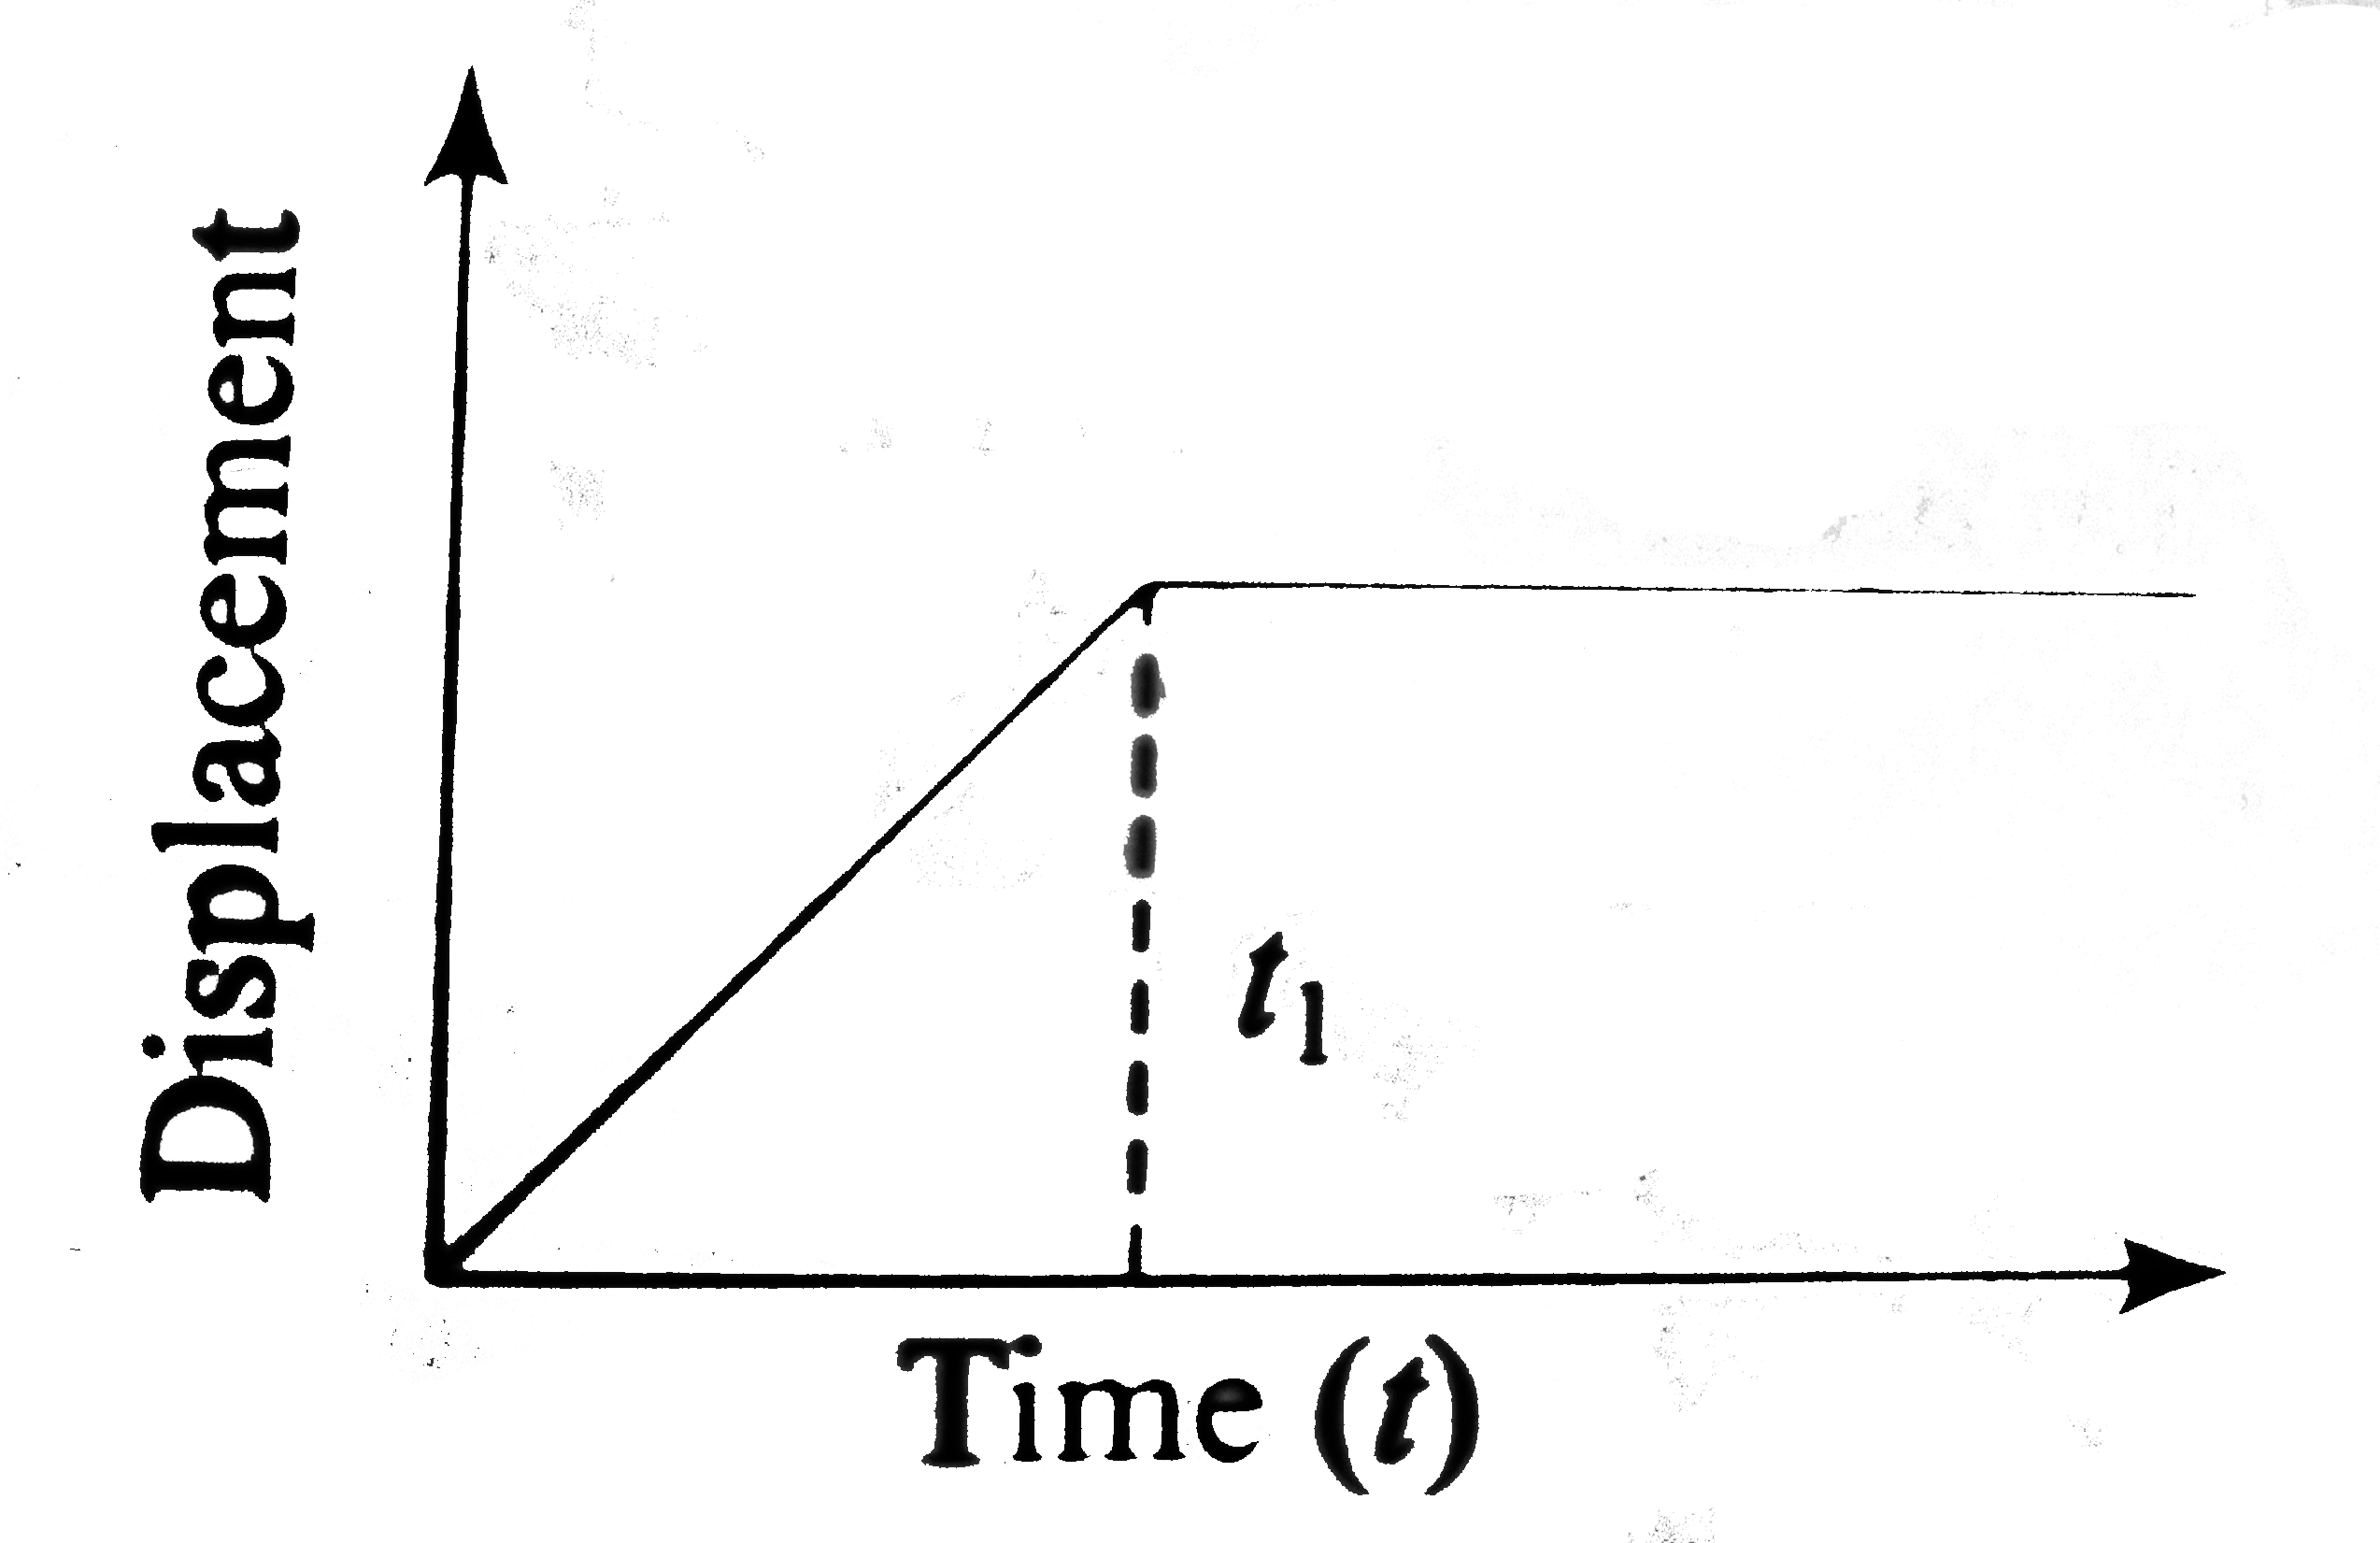
The x-t graph shoen in figure reprents
View SolutionThe x-t graph shown in figure represents

View SolutionThe x-t graph shown in figure represents.
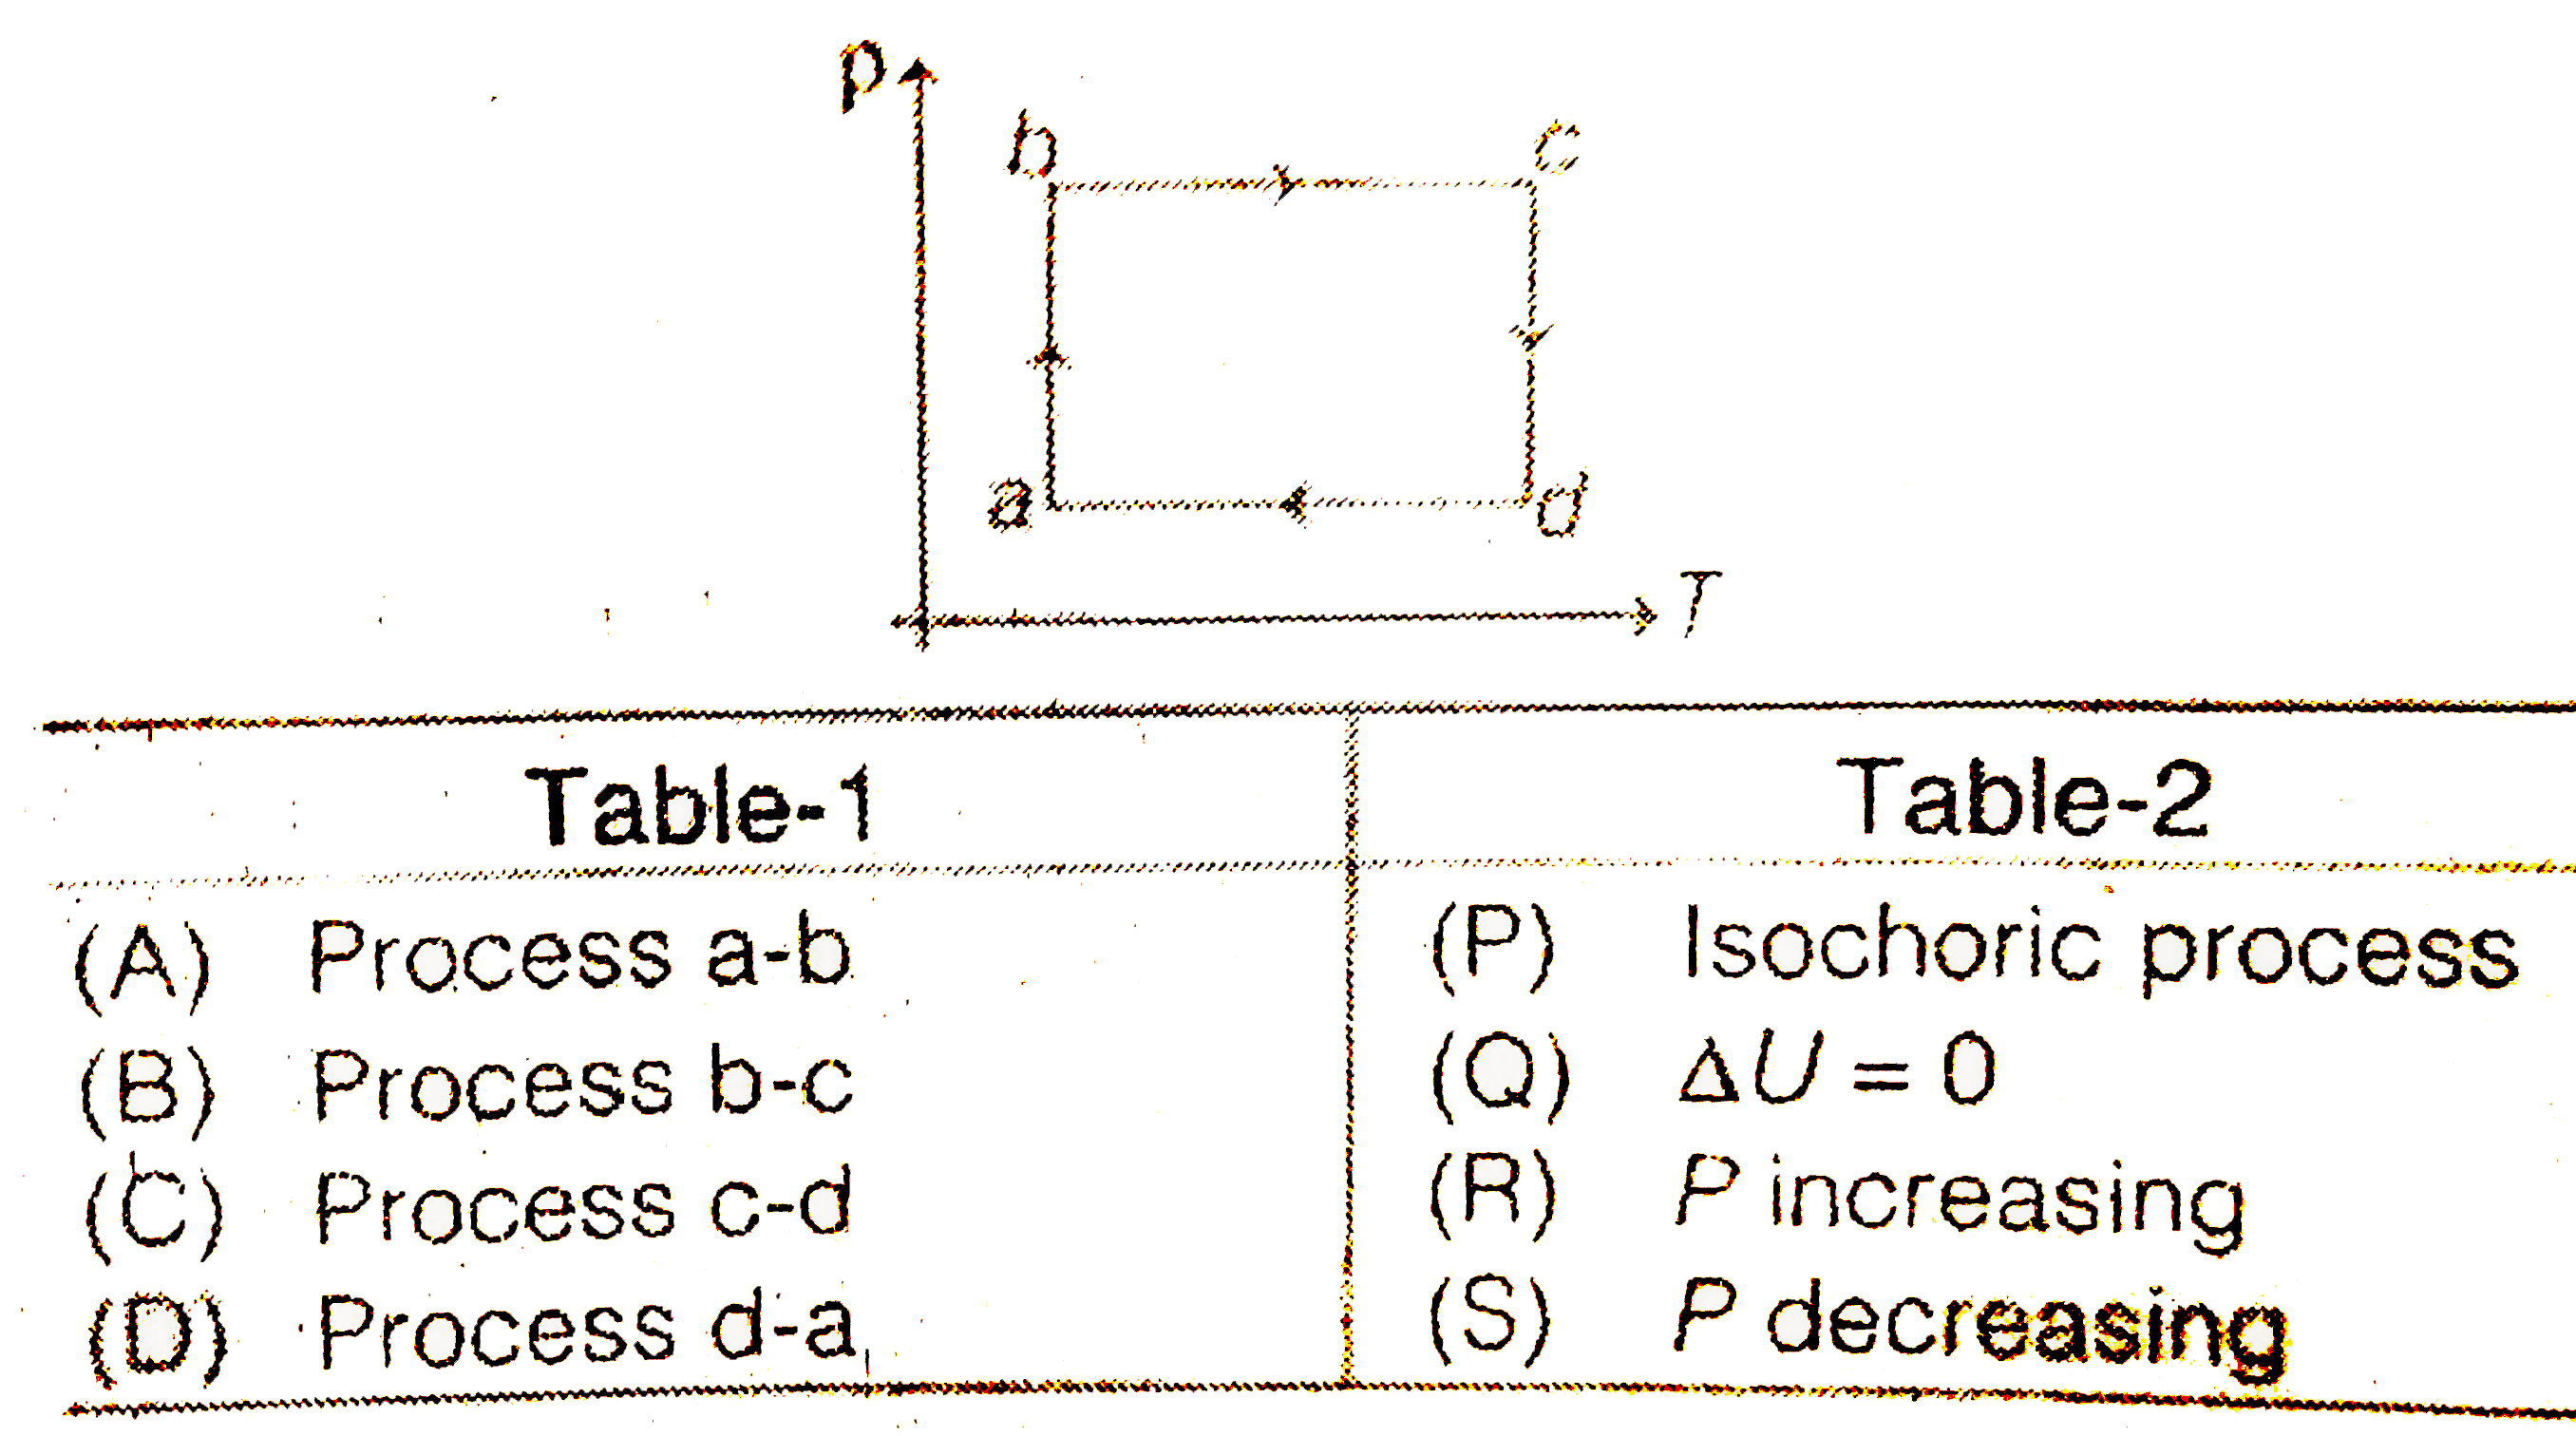
View SolutionIn the ρ-T graph shown in figure, match the following.
View SolutionCorresponding to y−t graph of a transverse harmonic wave shown in figure,
View SolutionIn the V-T graph shown in figure match the following.
View SolutionF-x and corresponding U-x graphs are as shown in figure. Three point A, B and C in F-x graph may be corresponding to P, Q and R in the U-x graph. Match the following
View SolutionFrom the p-T graph what conclusion can be drawn?
View SolutionIn the V-T graph shown in the figure match the following columns.
View SolutionFor the v-t graph shown in figure find the acccelertion in 0-4 sec and 4-8 sec.
View Solution
