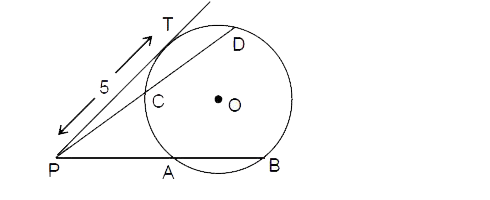
दिये गये चित्र में (वृत्त) PT = 5. PD=7 तथा PA = 2 हो, तो PB – PC का मान ज्ञात कीजिए।

The correct Answer is:12514
Step by step video, text & image solution for दिये गये चित्र में (वृत्त) PT = 5. PD=7 तथा PA = 2 हो, तो PB – PC का मान ज्ञात कीजिए। by Maths experts to help you in doubts & scoring excellent marks in Class 11 exams.
Updated on:21/07/2023Topper's Solved these Questions
- MATHEMATICS DPP NO. 07BOOK - RESONANCE HINDICHAPTER - MATHEMATICS DPP NO. 07EXERCISE - प्रश्न
2 Videos
- MATHEMATICS DPP NO. 06BOOK - RESONANCE HINDICHAPTER - MATHEMATICS DPP NO. 06EXERCISE - बहुविकल्पीय प्रश्न
8 Videos
- MATHEMATICS DPP NO. 08BOOK - RESONANCE HINDICHAPTER - MATHEMATICS DPP NO. 08EXERCISE - प्रश्न
5 Videos
Similar Questions
निम्न को 'पूर्ण वर्ग + कोई अचर' के रूप में बदलिए
(i) x2+x
(ii) x2+3x
View Solutionयदि A, 8 से छोटी सम प्राकृत संख्याओं का समुच्चय है तथा B, 7 से छोटी अभाज्य संख्याओं का समुच्चय है तो A से B में परिभाषित सम्बन्धों की संख्या है -
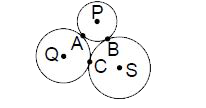
View SolutionP,Q एवं S केन्द्र वाले वृत्त चित्रानुसार परस्पर बिन्दु A, B एवं C पर बाह्यतः स्पर्श करते हैं। यदि P,Q एवं S केन्द्र वाले वृत्तों की त्रिज्याएँ क्रमशः 1,2 व 3 है, तो जीवा AB की लम्बाई ____________ है

View SolutionHow many lines of symmetry does the above figure have ?
View SolutionWhich of the following are correct chain isomers of butane ? (i)
View SolutionDetermine the point of symmetry of a regular hexagon.
View SolutionDtermine the images of the following figure about the given line :
View SolutionMatch the following Column A to Column B

View SolutionMatch the following Column A to Column B

View SolutionMatch the following Column A to Column B

View SolutionFind the area of the figure given below.

View SolutionThe area of the shaded part in the figure given below is ______.

View SolutionThe inequation represented by the graph given below is :
View SolutionThe inequation that best describes the graph given below is _________
View SolutionThe inequation that best describes the following graph is _________
View SolutionWhich inequations represent the shaded region in the given figure
View Solution
