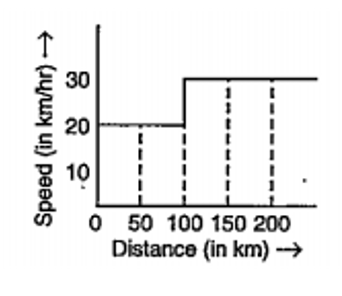
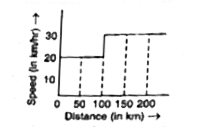
In the following graph the relation between speed and distance is given:

The average speed for the first 200 kms.(in km/hr)
(A) 24
(B) 25
(C) 26
(D) 40
The correct Answer is:A
Step by step video & image solution for In the following graph the relation between speed and distance is given: The average speed for the first 200 kms.(in km/hr) by Maths experts to help you in doubts & scoring excellent marks in Class 14 exams.
Updated on:21/07/2023Topper's Solved these Questions
Similar Questions
A car travels the first one-third of a certain distance with a speed of 10 km/hr, the next one-third distance with speed of 20 km/hr and the last one-third distance with a speed of 60 km/hr. The average speed of the car for the whole journey is
View Solutiona trip to a destination is made in the following way 900 km by train at an average speed of 60 km/hr, 3000 km by plane at an average speed of 500 km/hr, 400 km by boat at an average speed f 25 km/hr, 15 km by taxi at an average sped o f45 km/hr. what is the average speed for the entire journey?
View Solution
Knowledge Check
In the following graph the relation between speed and distance is given :

The average speed for the first 150 km :A15B18C25Dnone of theseA car moves a distance of 200m. It covers the first-half of the distance at speed 40km/h and the second-half of distance at speed vkm/h. The average speed is 48km/h. Find the value of v.
A56 km/hB60 km/hC50 km/hD48 km/hA car moves a distance of 200m. It covers the first-half of the distance at speed 40km/h and the second-half of distance at speed vkm/h. The average speed is 48km/h. Find the value of v.
A56km/hB60km/hC50km/hD48km/h
A bus travels at a certain average speed for a distance of 75 km and then travels a distance of 90 km at an average speed of 10 km//hr more than the first speed. If it takes 3 hours to complete the total journey, find its original speed.
View SolutionA car travels the first one third of a certain distant with a speed of 10 km/hr, the next one third distant with a speed of 20 km/hr and the last one third distance with a speed of 60 km/hr. The average speed of the car for the whole journey is 18 km/hr b. 24 km/hr c. 30km/hr d. 36 km/hr
View SolutionA man goes uphill with an average speed of 35 km/hr and covers down with an average speed of 45 km/hr the distance travelled in the both cases being the same the average speed for the entire journey is
View SolutionIf P travelled the first half of a journey at 40 km/hr and the remaining half distance at 50 km/hr, what is the average speed of his travel ?
A. 44.44 km/hr
B. 53.33 km/hr
C. 45 km/hr
D. 60 km/hr
View SolutionA man, on tour, travels first 160 km at 64 km/h and the next 160 km at 80 km/h. The average speed for the first 320 km of the tour is
View Solution