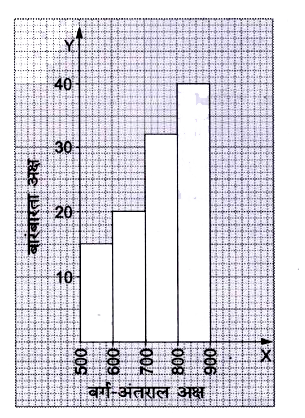
आपके मुहल्ले के 107 व्यक्तियों की मासिक आय का आयतचित्र निम्नांकित चित्र है, तो निम्नलिखित में खाली स्थानों को भरिए
500 रु. से लेकर 600 रु. से कम तक की आय प्राप्त करनेवाले व्यक्तियों की संख्या है।

Step by step video & image solution for आपके मुहल्ले के 107 व्यक्तियों की मासिक आय का आयतचित्र निम्नांकित चित्र है, तो निम्नलिखित में खाली स्थानों को भरिए 500 रु. से लेकर 600 रु. से कम तक की आय प्राप्त करनेवाले व्यक्तियों की संख्या है। by Maths experts to help you in doubts & scoring excellent marks in Class 8 exams.
Updated on:21/07/2023Topper's Solved these Questions
- आँकड़ों का प्रयोग BOOK - DAS GUPTACHAPTER - आँकड़ों का प्रयोग EXERCISE - प्रश्नमाला 15 (C )
20 Videos
- आँकड़ों का प्रयोग BOOK - DAS GUPTACHAPTER - आँकड़ों का प्रयोग EXERCISE - प्रश्नमाला 15 (D )
14 Videos
- आँकड़ों का प्रयोग BOOK - DAS GUPTACHAPTER - आँकड़ों का प्रयोग EXERCISE - प्रश्नमाला 15 (A)
68 Videos
- अंकगणित BOOK - DAS GUPTACHAPTER - अंकगणित EXERCISE - विविध प्रश्नमाला 10
23 Videos
- आलेखBOOK - DAS GUPTACHAPTER - आलेखEXERCISE - प्रश्नमाला 16(B)
9 Videos
Similar Questions
एक परिवार की मासिक आमदनी 7200 रु. है। विभिन्न मदों में मासिक व्यय निम्न रूप हैं

न आँकड़ों के लिए एक वृत आलेख खींचिए।
View Solutionएक थैला में 7 हरी और 4 पीली गेंदें हैं। थैले के अंदर से बिना देखे एक गेंद निकाली जाती है।
(a) एक हरी गेंद प्राप्त करने की प्रायिकता क्या है?
(b) एक पीली गेंद प्राप्त करने की प्रायिकता क्या है?
View Solutionकिसी प्रेक्षण में उसके महत्तम एवं न्यूनतम मानों के अंतर को प्रेक्षण का क्या कहा जाता है?
View Solutionरिक्त स्थानों की पूर्ती कीजिए -
क्रय - मूल्य (1+लाभ की दर100)=…….
View Solutionएक बैंक अपने ग्राहक को जमा धन पर 8% साधारण व्याज देता है। जमा धन तथा उसपर अर्जित वार्षिक साधारण ब्याज के लिए एक आलेख खींचिए। इस आलेख से निम्नलिखित . प्रश्नों के उत्तर दीजिए
450 Rs. जमा करने पर प्राप्त व्याज कितना होगा?
View SolutionDetermine the point of symmetry of a regular hexagon.
View SolutionMatch the following Column A to Column B

View SolutionMatch the following Column A to Column B

View SolutionMatch the following Column A to Column B

View SolutionThe inequation represented by the graph given below is :
View SolutionThe inequation that best describes the graph given below is _________
View SolutionThe inequation that best describes the following graph is _________
View Solutionनिम्नलिखित वितरण का माध्यक निकाले

View SolutionFind the mean of the following distribution. {:("दैनिक मजदूरी (रु. में)",25,26,27,28,29,30,31,32),("व्यक्तियों की संख्या",25,15,20,40,10,30,35,25):}
View SolutionThe income of A is 25% more than that of B and the income of C is 65% less than the sum of the incomes of A and B. Income of C is what percent less than the income of A?
A की आय B की आय से 25% अधिक है और C की आय A और B की आय के योग से 65% कम है | C की आय A की आय से कितना प्रतिशत कम है ?
View SolutionThe income of A is 24% more than the income of B. By what percent is the income of B less than the income of A? /
A की आय B की आय से 24% अधिक है | B की आय A की आय से कितना प्रतिशत कम है ?
View Solution