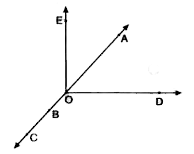
दी गई आकृति में कितने रेखाखंड है।

Step by step video & image solution for दी गई आकृति में कितने रेखाखंड है। by Maths experts to help you in doubts & scoring excellent marks in Class 6 exams.
Updated on:21/07/2023Topper's Solved these Questions
- प्रारंभिक आकृतियों को समझना BOOK - DAS GUPTACHAPTER - प्रारंभिक आकृतियों को समझना EXERCISE - प्रश्नमाला 11(B)
23 Videos
- प्रारंभिक आकृतियों को समझना BOOK - DAS GUPTACHAPTER - प्रारंभिक आकृतियों को समझना EXERCISE - प्रश्नमाला 11(C)
2 Videos
- प्रारंभिक आकृतियों को समझना BOOK - DAS GUPTACHAPTER - प्रारंभिक आकृतियों को समझना EXERCISE - प्रश्नमाला 11(G) (निम्नांकित रिक्त स्थानों को भरिए। )
16 Videos
- प्रायोगिक ज्यामिति (रचनाएँ) BOOK - DAS GUPTACHAPTER - प्रायोगिक ज्यामिति (रचनाएँ) EXERCISE - नवम जाँच - परीक्षा के प्रश्न - पत्र (रिक्त स्थानों को भरिए)
15 Videos
- बीजगणितBOOK - DAS GUPTACHAPTER - बीजगणितEXERCISE - अक्षरों तथा संख्याओं का प्रयोग क्र जोड़, घटाव, घटाव, गुणा तथा भाग की संक्रियाओं को व्यक्त करना-निम्नलिखित्त प्रश्नो के उत्तर देखिये और समझिये।
28 Videos
Similar Questions
नीचे लिखे कोणों की माप डिग्री में व्यक्त कीजिए।
एक समकोण
View Solutionसंकेत ←→AB∣∣←→CD को भाषा में व्यक्त कीजिए।
View Solutionएक बेलन के आधार वाला फलक और ऊपरी फलक . . . . . . . . . . . होते है।
View Solutionकोणों के आधार पर त्रिभुज कितने प्रकार के होते हैं ?
View Solutionराम के पास 10 रु. है। मैंने राम को 5 रु. दिय। अब राम के पास कितने रूपये है?
View SolutionHow many lines of symmetry does the above figure have ?
View SolutionWhich of the following are correct chain isomers of butane ? (i)
View SolutionDetermine the point of symmetry of a regular hexagon.
View SolutionDtermine the images of the following figure about the given line :
View SolutionMatch the following Column A to Column B

View SolutionMatch the following Column A to Column B

View SolutionMatch the following Column A to Column B

View SolutionFind the area of the figure given below.

View SolutionThe area of the shaded part in the figure given below is ______.

View SolutionThe inequation represented by the graph given below is :
View SolutionThe inequation that best describes the graph given below is _________
View Solution
