For a reaction a graph plotted between log(dxdt)andlog(a−x) along y and x axes respectively shows a straight line with a positive slope of 45∘. The order of the reaction is
0
1
2
3
The correct Answer is:B
To determine the order of the reaction from the given information, we can follow these steps:
Step 1: Understand the relationship
The question states that a graph is plotted between log(dxdt) (the logarithm of the rate of reaction) and log(a−x) (the logarithm of the remaining concentration of reactant). The slope of this graph is given as 45degrees.
Step 2: Interpret the slope
A slope of 45degrees indicates that the slope is equal to 1. In mathematical terms, this means:
\(
\text{slope} = 1
\)
This implies that:
\(
\log\left(\frac{dx}{dt}\right) = m \cdot \log(a - x) + c
\)
where \( m = 1 \).
Step 3: Relate to the rate law
For a reaction of order \( n \), the rate of reaction can be expressed as:
\(
\frac{dx}{dt} = k(a - x)^n
\)
Taking logarithms on both sides gives:
\(
\log\left(\frac{dx}{dt}\right) = \log(k) + n \cdot \log(a - x)
\)
This is in the form of a straight line \( y = mx + c \), where:
- \( y = \log\left(\frac{dx}{dt}\right) \)
- \( x = \log(a - x) \)
- \( m = n \) (the order of the reaction)
- \( c = \log(k) \)
Step 4: Determine the order of the reaction
Since the slope \( m \) is equal to \( 1 \) (from the 45-degree angle), we can conclude that:
\(
n = 1
\)
This indicates that the reaction is of first order.
Conclusion
Thus, the order of the reaction is 1.
---
The question states that a graph is plotted between log(dxdt) (the logarithm of the rate of reaction) and log(a−x) (the logarithm of the remaining concentration of reactant). The slope of this graph is given as 45degrees.
A slope of 45degrees indicates that the slope is equal to 1. In mathematical terms, this means:
\(
\text{slope} = 1
\)
This implies that:
\(
\log\left(\frac{dx}{dt}\right) = m \cdot \log(a - x) + c
\)
where \( m = 1 \).
For a reaction of order \( n \), the rate of reaction can be expressed as:
\(
\frac{dx}{dt} = k(a - x)^n
\)
Taking logarithms on both sides gives:
\(
\log\left(\frac{dx}{dt}\right) = \log(k) + n \cdot \log(a - x)
\)
This is in the form of a straight line \( y = mx + c \), where:
- \( y = \log\left(\frac{dx}{dt}\right) \)
- \( x = \log(a - x) \)
- \( m = n \) (the order of the reaction)
- \( c = \log(k) \)
Since the slope \( m \) is equal to \( 1 \) (from the 45-degree angle), we can conclude that:
\(
n = 1
\)
This indicates that the reaction is of first order.
Thus, the order of the reaction is 1.
Topper's Solved these Questions
Similar Questions
Knowledge Check
- Question 1 - Select One
For the reaction A→products , the graph of the fraction of A remaining as a function of time (x− axis ) is a straight line with −ve slpe . The order of the reaction is therefore
A1B2CzeroD−1 - Question 2 - Select One
For a given reaction the logarithm of the concentration of the reactant plotted against time gave a straight line with negative slope . The order of the reaction is
A3B2C1D0 - Question 3 - Select One
For a lst order reaction , a straight line is obtained if you plot
Alog conc. vs timeBconc. vs timeC1/conc. vs timeDlog conc. vs 1/time
The plot of concentration of the reactant vs time for a reaction is a straight line with a negative slope. This reaction follows
View SolutionIf a graph is plotted between log(a−x) and t, the slope of the straight line is equal to −0.03. The specific reaction rate will be
View SolutionFor the order reaction , plot of log10(a−x) against time t is a straight line with a negative slope equal to ________.
View SolutionA plot between time and the amount of reactant consumed is found to be a straight line passing through origin for a reaction. The order of the reaction is
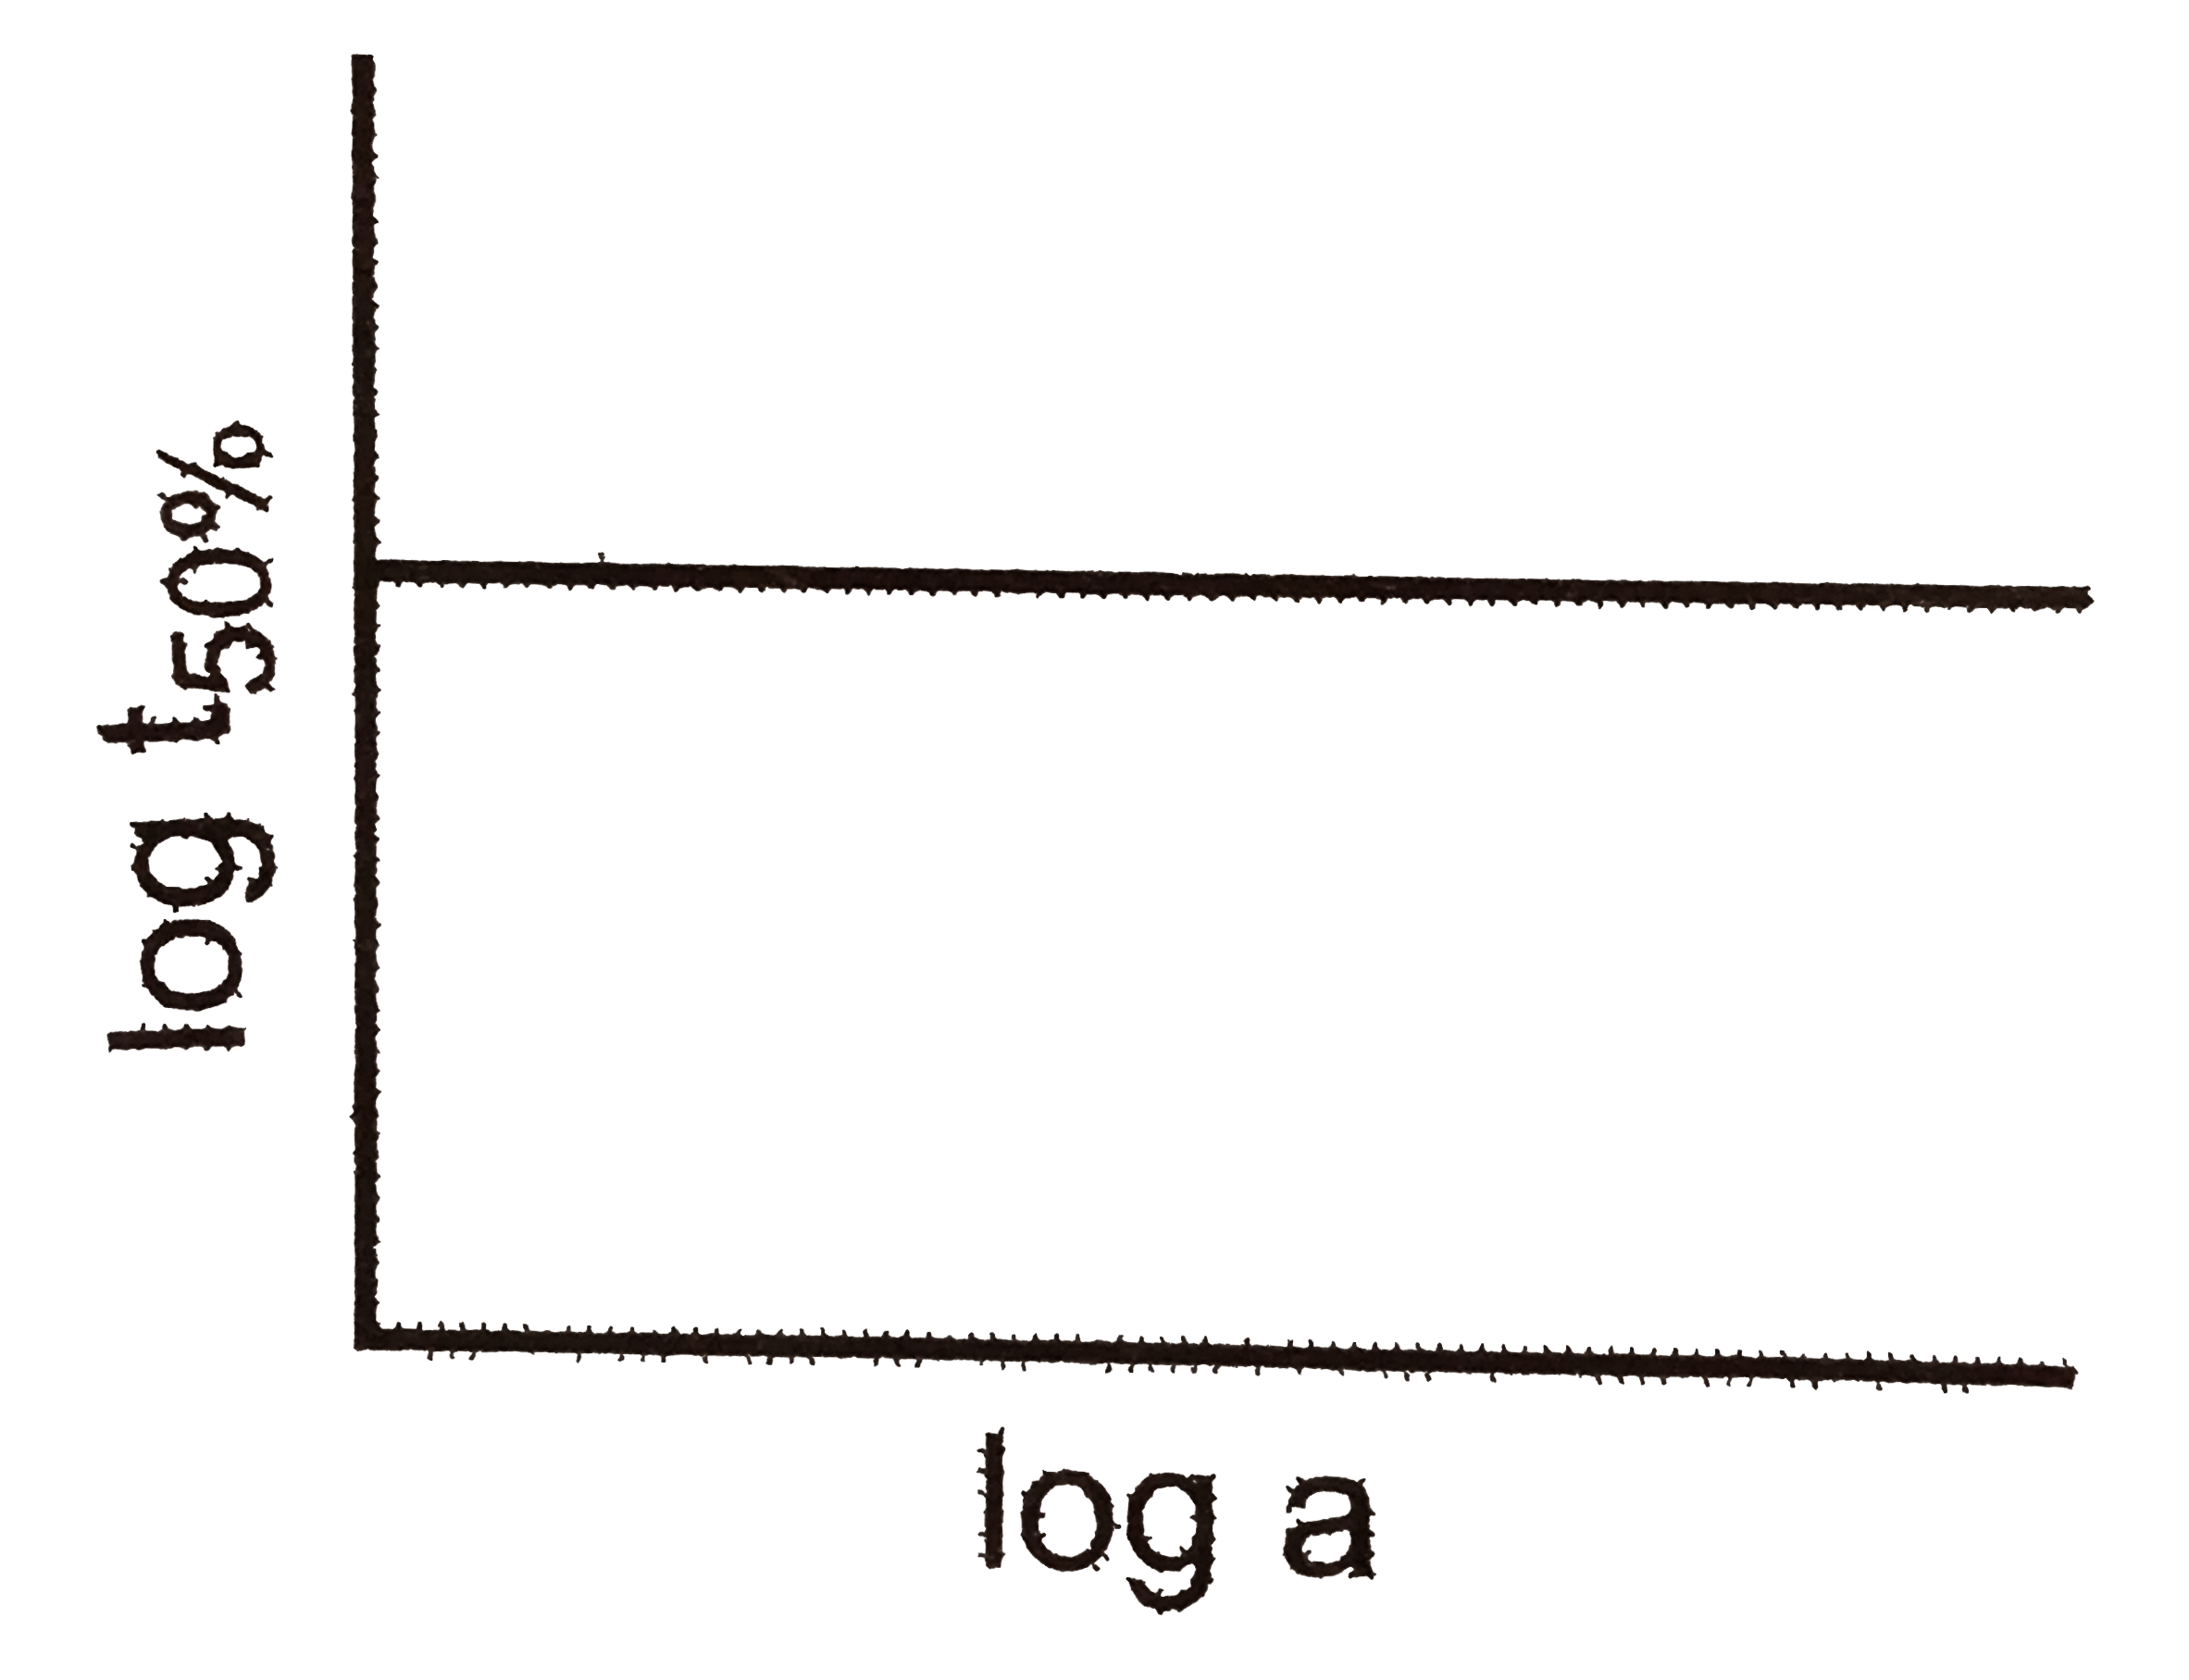
View SolutionA graph plotted between log t50% vs log concentration is a straight line. What conclusion can you draw from this graph?
 View Solution


