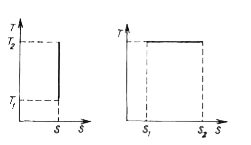
Plot the T-S diagram (i.e. the entropy vs temperature dependence) (a) for an adiabatic process, (b) for an isothermic process.
Text Solution
|
Similar Questions
Knowledge Check
Entropy change for an adiabatic reversible process is
AzeroB+veC−veDnegative or zeroEntropy change for an adiabatic reversible process is :
ApositiveBzeroCnegativeDinfinity
Show that the slope of p−V diagram is greater for an adiabatic process as compared to an isothermal process.
View SolutionShow that the slope of p−V diagram is greater for an adiabatic process as compared to an isothermal process.
View SolutionReversible Isothermal and Adiabatic process
View SolutionReversible Isothermal and Adiabatic process
View SolutionComparison Between Isothermal And Adiabatic Process
View Solutionanalysis OF adiabatic process, comparison OF isothermal and adiabatic process
View Solution

