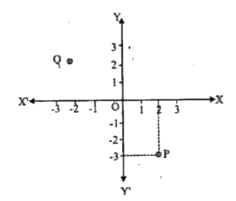
चित्र में , बिंदु P के निर्देशांक है -

(2,−2)
(−2,2)
(2,-3)
(3,-2)
The correct Answer is:C
Step by step video, text & image solution for चित्र में , बिंदु P के निर्देशांक है - by Maths experts to help you in doubts & scoring excellent marks in Class 9 exams.
Updated on:21/07/2023Topper's Solved these Questions
- MATHEMATICS BOOK - S CHANDCHAPTER - MATHEMATICS EXERCISE - दो चरों वाले रैखिक समीकरण (बहुविकल्पीय प्रश्न)
33 Videos
- MATHEMATICS BOOK - S CHANDCHAPTER - MATHEMATICS EXERCISE - यूक्लिड ज्यामिति का परिचय (बहुविकल्पीय प्रश्न)
33 Videos
- MATHEMATICS BOOK - S CHANDCHAPTER - MATHEMATICS EXERCISE - बहुपद (बहुविकल्पीय प्रश्न )
48 Videos
- ANNUAL EXAMINATION-2020 (गणित)BOOK - S CHANDCHAPTER - ANNUAL EXAMINATION-2020 (गणित)EXERCISE - बहुविकल्पीय प्रश्न
40 Videos
- MATHEMATICS EXAMINATION, 2020BOOK - S CHANDCHAPTER - MATHEMATICS EXAMINATION, 2020EXERCISE - बहुविकल्पीय प्रश्न
40 Videos
Similar Questions
एकघातीय समीकरण ax+by+c=0 के वास्तविक हलों की संख्या है -
View Solutionएक दिए गए बिन्दु से होकर कितनी रेखाएँ जा सकती हैं?
View Solutionनिम्नलिखित व्यंजकों में कौन बहुपद नहीं है?
View Solutionनिम्नलिखित में कौन परिमेय संख्या है?
View Solutionनिम्नलिखित में कौन परिमेय संख्या है?
View SolutionIdentify the cell organelle 'A' :-
ltimg src="https://d10lpgp6xz60nq.cloudfront.net/physics_images/ALN_BIO_C10_E08_018_Q01.png" width="80%"gt
View SolutionHow many lines of symmetry does the above figure have ?
View SolutionWhich of the following are correct chain isomers of butane ? (i)
View SolutionDetermine the point of symmetry of a regular hexagon.
View SolutionDtermine the images of the following figure about the given line :
View SolutionMatch the following Column A to Column B

View SolutionMatch the following Column A to Column B

View SolutionMatch the following Column A to Column B

View SolutionThe inequation represented by the graph given below is :
View SolutionThe inequation that best describes the graph given below is _________
View SolutionThe inequation that best describes the following graph is _________
View Solution
