sunflower, hibiscus, pea, grass
Step-by-Step Solution:
1. Identify the Plants: The plants given are sunflower, hibiscus, pea, and grass.
2. Classify the Plants:
- Sunflower: This plant is classified as a dicot because it has two cotyledons.
- Hibiscus: This plant is also a dicot, as it similarly has two cotyledons.
- Pea: Like the sunflower and hibiscus, the pea plant is classified as a dicot because it has two cotyledons.
- Grass: Grass is classified as a monocot, which means it has only one cotyledon.
3. Compare the Classifications:
- Sunflower, hibiscus, and pea are all dicots (having two cotyledons).
- Grass is the only monocot (having one cotyledon).
4. Determine the Odd One Out: Since sunflower, hibiscus, and pea are all dicots and grass is a monocot, grass is the odd one out.
5. Conclusion: The odd one out among sunflower, hibiscus, pea, and grass is grass.
---
- Sunflower: This plant is classified as a dicot because it has two cotyledons.
- Hibiscus: This plant is also a dicot, as it similarly has two cotyledons.
- Pea: Like the sunflower and hibiscus, the pea plant is classified as a dicot because it has two cotyledons.
- Grass: Grass is classified as a monocot, which means it has only one cotyledon.
- Sunflower, hibiscus, and pea are all dicots (having two cotyledons).
- Grass is the only monocot (having one cotyledon).
Topper's Solved these Questions
- THE FLOWER BOOK - ICSECHAPTER - THE FLOWER EXERCISE - Exercises (State the agents of pollination for each of the following.)
6 Videos
- THE FLOWER BOOK - ICSECHAPTER - THE FLOWER EXERCISE - Exercises (Differentiate between)
4 Videos
- THE FLOWER BOOK - ICSECHAPTER - THE FLOWER EXERCISE - Exercises (Match the columns.)
1 Videos
- THE CIRCULATORY SYSTEMBOOK - ICSECHAPTER - THE CIRCULATORY SYSTEMEXERCISE - REVIEW QUESTIONS (Long answer questions)
4 Videos
- THE LEAF BOOK - ICSECHAPTER - THE LEAF EXERCISE - REVIEW QUESTONS (LONG ANSWER QUESTIONS (WRITE THE ANSWER IN YOUR NOTEBOOK)
12 Videos
Similar Questions
Knowledge Check

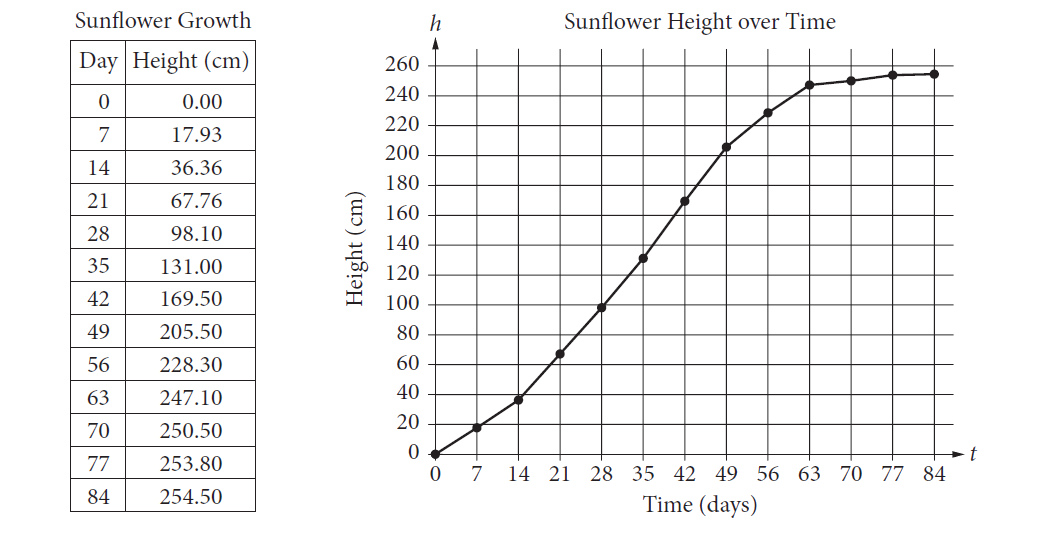
In 1919, H. S. Reed and R. H. Holland published a paper on the growth of sunflowers. Included in the paper were the table and graph above, which show the height h, in centimeters, of a sunflower t days after the sunflower begins to grow.
Over which of the following time periods is the average growth rate of the sunflower least?ADay 0 to Day 21BDay 21 to Day 42CDay 42 to Day 63DDay 63 to Day 84
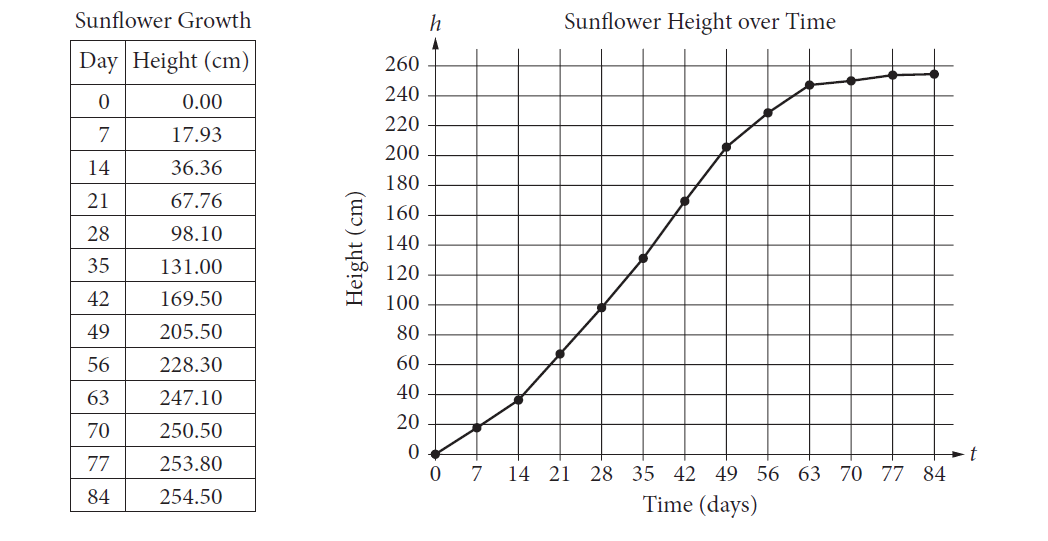
In 1919, H. S. Reed and R. H. Holland published a paper on the growth of sunflowers. Included in the paper were the table and graph above, which show the height h, in centimeters, of a sunflower t days after the sunflower begins to grow.
The growth rate of the sunflower from day 14 to day 35 is nearly constant. On this interval, which of the following equations best models the height h, in centimeters, of the sunflower t days after it begins to grow?Ah = 2.1t − 15Bh = 4.5t − 27Ch = 6.8t − 12Dh = 13.2t − 18
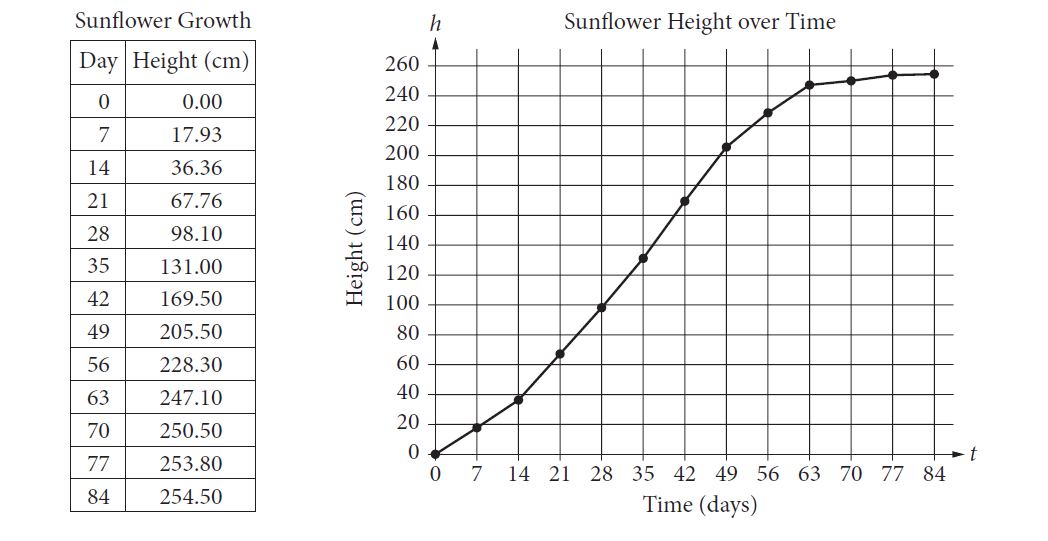
In 1919, H. S. Reed and R. H. Holland published a paper on the growth of sunflowers. Included in the paper were the table and graph above, which show the height h, in centimeters, of a sunflower t days after the sunflower begins to grow.
The function h, defined by h(t) = at + b , where a and b are constants, models the height, in centimeters, of the sunflower after t days of growth during a time period in which the growth is approximately linear. What does a represent?AThe predicted number of centimeters the sunflower grows each day during the periodBThe predicted height, in centimeters, of the sunflower at the beginning of the periodCThe predicted height, in centimeters, of the sunflower at the end of the periodDThe predicted total increase in the height of the sunflower, in centimeters, during the period
Match column I with column II and select the correct option from given codes.
Column IColumn IIA. Marginal(i) Sunflower, marigoldB. parietal(ii) PeaC Axile(iii) Mustard,ArgemoneD. Free central(iv) Hibiscus,ArgemoneE. Basal(v) Dianthus, Primorse
View SolutionWhich of the following plants have albuminous seeds ?
(Wheat , pea black pepper ,castor, sunflower, groundnut , barley)
View SolutionFrom the given list how many are not associated with asexual reproduction?
Sugarcane, ginger, maize, barley, tobacco, pea, sunflower, potato, Bryophyllum
View SolutionSunflower is not a flower. Explain.
View SolutionSunflower is not a flower. Explain.
View Solution
