The volume of an ideal gas Vis filled in a cylinder fitted with a piston at pressure P: The volume of the gas is changed to 4V each time by three different processes : (i) Change at constant pressure (ii) Adiabatic change (iii) Isothermal changes. Show these changes on P-V diagram. State giving reason in which change the work done is maximum.
To solve the problem step by step, we will analyze the three processes of changing the volume of an ideal gas from V to 4V, and then we will illustrate these processes on a P-V diagram. Finally, we will determine in which process the work done is maximum.
Step 1: Understand the Processes
1. Constant Pressure Process: In this process, the pressure remains constant while the volume changes from V to 4V.
2. Adiabatic Process: In this process, the gas expands without exchanging heat with its surroundings. The pressure will decrease as the volume increases.
3. Isothermal Process: In this process, the temperature remains constant while the gas expands. The pressure will also decrease as the volume increases.
Step 2: Draw the P-V Diagram
1. Set up the axes: Draw a graph with pressure (P) on the y-axis and volume (V) on the x-axis.
2. Mark initial and final states: Mark the initial point (V, P) and the final point (4V, P') where P' is the pressure after expansion.
3. Draw the Constant Pressure Process: Draw a horizontal line from (V, P) to (4V, P). This line represents the constant pressure process.
4. Draw the Adiabatic Process: Draw a curve that starts from (V, P) and ends at (4V, P') which slopes downward more steeply than the isothermal curve.
5. Draw the Isothermal Process: Draw a curve that starts from (V, P) and ends at (4V, P') but is less steep than the adiabatic curve.
Step 3: Calculate Work Done
1. Work Done in Constant Pressure Process: The work done (W) is equal to the area under the curve. For constant pressure, W = P * (4V - V) = P * 3V.
2. Work Done in Adiabatic Process: The work done can be calculated using the formula for adiabatic processes, but it will be less than the work done in the constant pressure process.
3. Work Done in Isothermal Process: The work done in an isothermal process can be calculated using the formula W = nRT ln(Vf/Vi), which will also be less than the work done in the constant pressure process.
Step 4: Conclusion
- From the analysis, we can conclude that the work done is maximum in the constant pressure process because it has the largest area under the P-V curve compared to the adiabatic and isothermal processes.
P-V Diagram Summary
- Constant Pressure: Horizontal line from (V, P) to (4V, P).
- Adiabatic: Downward sloping curve from (V, P) to (4V, P').
- Isothermal: Downward sloping curve from (V, P) to (4V, P') but less steep than the adiabatic curve.
1. Constant Pressure Process: In this process, the pressure remains constant while the volume changes from V to 4V.
2. Adiabatic Process: In this process, the gas expands without exchanging heat with its surroundings. The pressure will decrease as the volume increases.
3. Isothermal Process: In this process, the temperature remains constant while the gas expands. The pressure will also decrease as the volume increases.
1. Set up the axes: Draw a graph with pressure (P) on the y-axis and volume (V) on the x-axis.
2. Mark initial and final states: Mark the initial point (V, P) and the final point (4V, P') where P' is the pressure after expansion.
3. Draw the Constant Pressure Process: Draw a horizontal line from (V, P) to (4V, P). This line represents the constant pressure process.
4. Draw the Adiabatic Process: Draw a curve that starts from (V, P) and ends at (4V, P') which slopes downward more steeply than the isothermal curve.
5. Draw the Isothermal Process: Draw a curve that starts from (V, P) and ends at (4V, P') but is less steep than the adiabatic curve.
1. Work Done in Constant Pressure Process: The work done (W) is equal to the area under the curve. For constant pressure, W = P * (4V - V) = P * 3V.
2. Work Done in Adiabatic Process: The work done can be calculated using the formula for adiabatic processes, but it will be less than the work done in the constant pressure process.
3. Work Done in Isothermal Process: The work done in an isothermal process can be calculated using the formula W = nRT ln(Vf/Vi), which will also be less than the work done in the constant pressure process.
- From the analysis, we can conclude that the work done is maximum in the constant pressure process because it has the largest area under the P-V curve compared to the adiabatic and isothermal processes.
- Constant Pressure: Horizontal line from (V, P) to (4V, P).
- Adiabatic: Downward sloping curve from (V, P) to (4V, P').
- Isothermal: Downward sloping curve from (V, P) to (4V, P') but less steep than the adiabatic curve.
Topper's Solved these Questions
- INTERNAL ENERGY BOOK - ICSECHAPTER - INTERNAL ENERGY EXERCISE - SHORT ANSWER QUESTIONS
30 Videos
- INTERNAL ENERGY BOOK - ICSECHAPTER - INTERNAL ENERGY EXERCISE - VERY SHORT ANSWER QUESTIONS
17 Videos
- INTERNAL ENERGY BOOK - ICSECHAPTER - INTERNAL ENERGY EXERCISE - CONCEPTUAL SHORT ANSWER QUESTIONS WITH ANSWERS
17 Videos
- GRAVITATIONBOOK - ICSECHAPTER - GRAVITATIONEXERCISE - FROM THE HUBBLE TELESCOP
2 Videos
- MOTION IN FLUIDS BOOK - ICSECHAPTER - MOTION IN FLUIDS EXERCISE - SELECTED PROBLEMS (FROM POISEUILLE.S FORMULA)
19 Videos
Similar Questions
Write the relation between pressure and volume for an adiabatic change in an ideal gas.
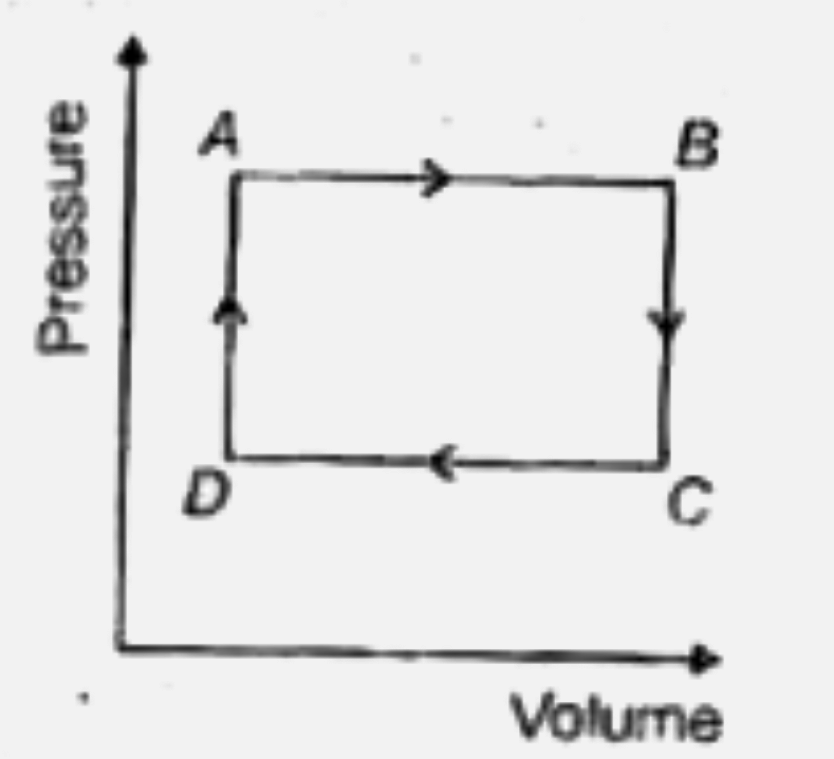
View SolutionThe pressure and volume of a gas are changed as shown in the p-V diagram in the figrue ahead. The thmperature of the gas

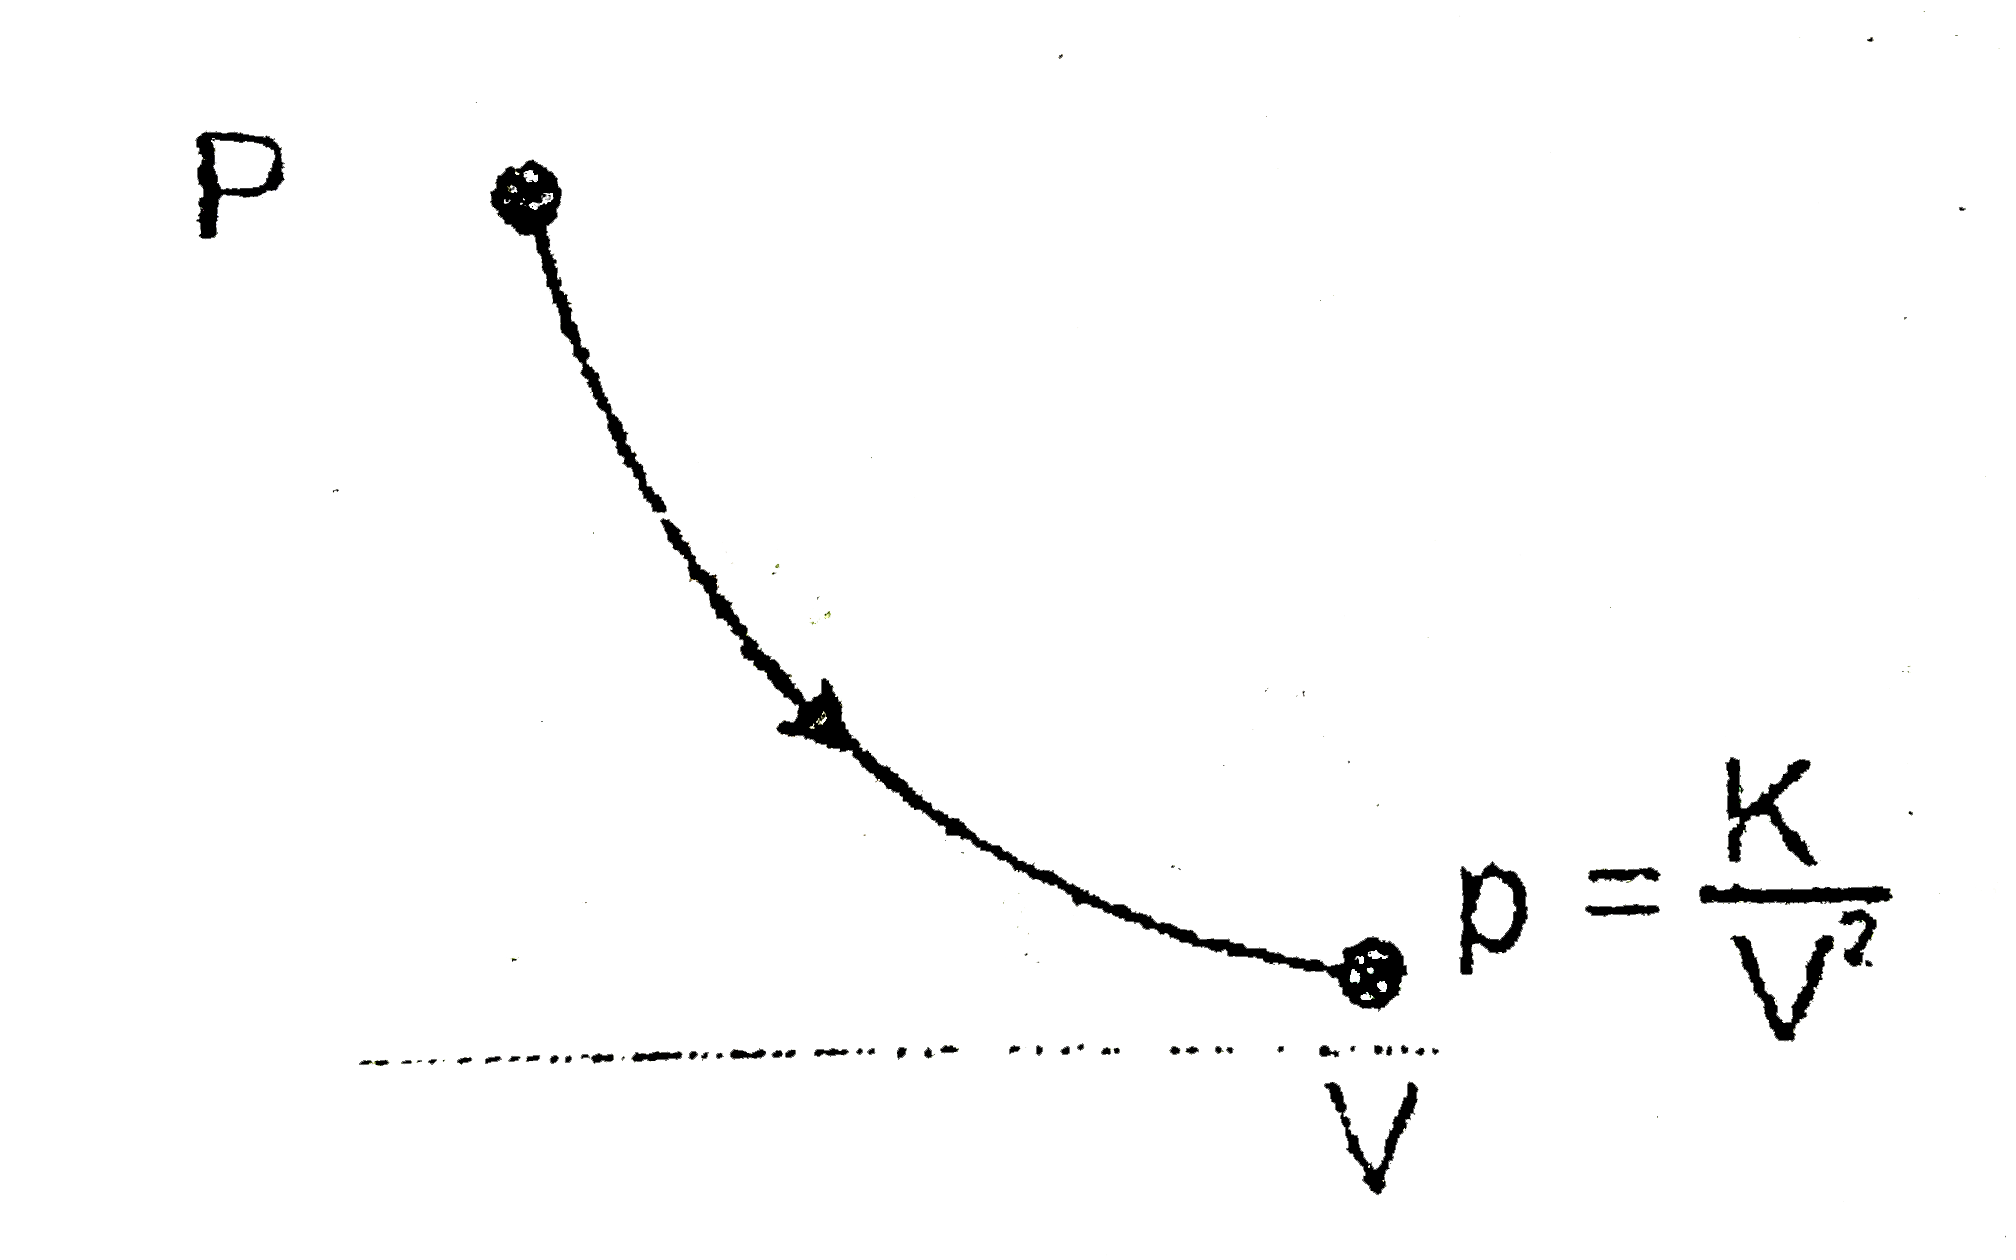
View SolutionThe molar heat capacity for the process shown in fig. is

View SolutionThe change in entropy when the pressure of perfect gas is changed isothermally from P1 to P2 is
View SolutionAssertion: For an ideal gas in a cyclic process and in an isothermal process change in internal energy is zero.
Reason: In both processes there is no change in temperature.
View SolutionDefine Bulk modulus of elasticity and write an expression in terms of pressure .P., volume .V. and change in volume .ΔV..
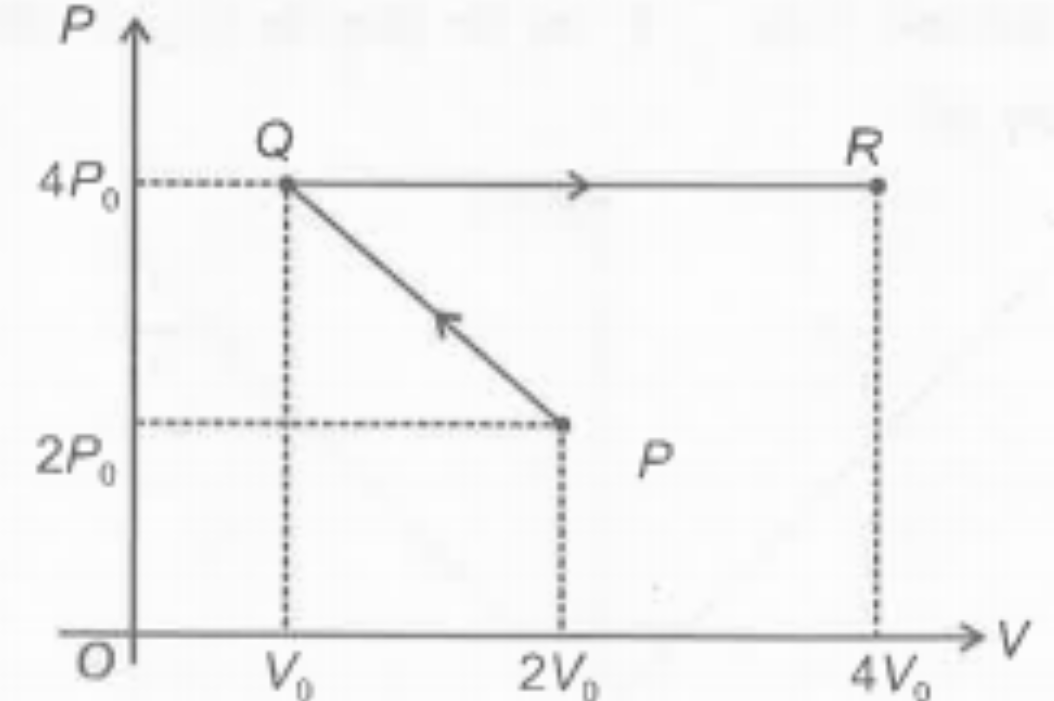
View SolutionAn ideal gas undergoes a process P→Q→R as shown in pressure (p) - volume (v) diagram.The work done by the gas is

View SolutionTemperature of an ideal gas is 300 K. The change in temperature of the gas when its volume changes from V to 2V in the process p = aV (Here, a is a positive constant) is
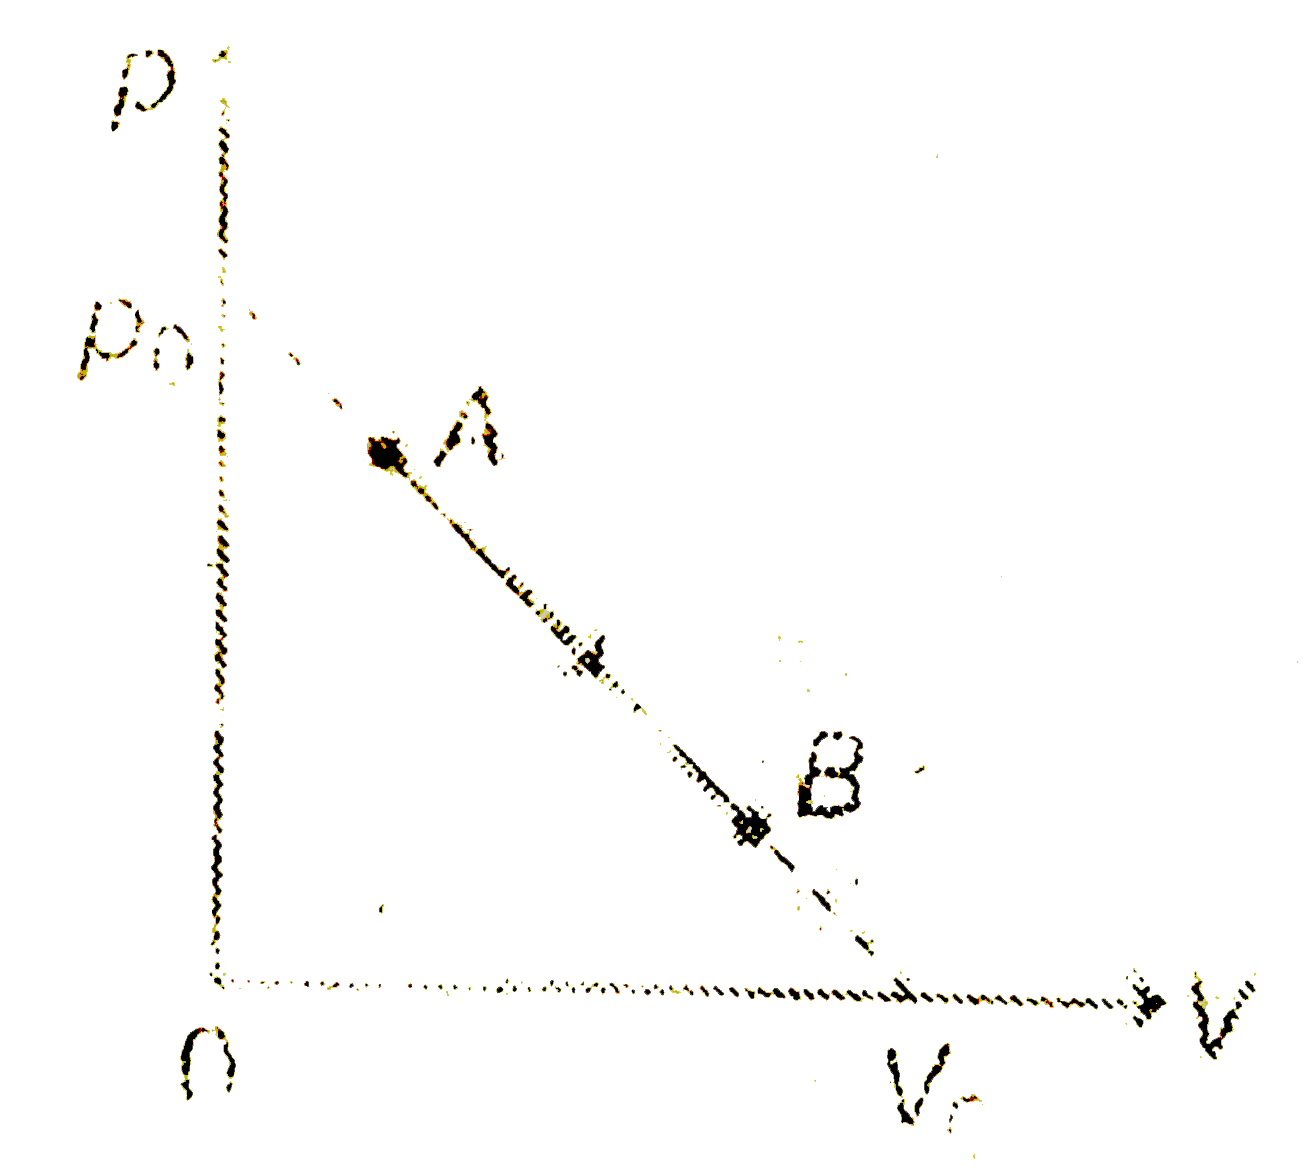
View SolutionOne mole of an ideal monotomic gas undergoes a linear process from A to B in which its pressure p and its volume V change as shown in figure.

The maximum temperature of the gas during this process is
View SolutionFor an adiabatic expansion of an ideal gas the fractional change in its pressure is equal to
View Solution
