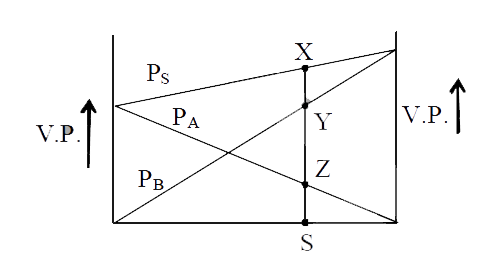
Graphs for ideal Binary Solution- Vapor Pressure v/s Liquid Composition /Vapor Pressure v/s Vapour Composition/Vapor Pressure v/s Composition
Step by step video solution for Graphs for ideal Binary Solution- Vapor Pressure v/s Liquid Composition /Vapor Pressure v/s Vapour Composition/Vapor Pressure v/s Composition by Chemistry experts to help you in doubts & scoring excellent marks in Class 12 exams.
Similar Questions
Knowledge Check
- Question 1 - Select One or More
Consider following vapour pressure composition graph. Hence-
 AV.P. of A = SZBV.P. of B = ZYCV.P. of B = SYDV.P. of solution at X = SZ + SY
 - Question 2 - Select One or More
Consider the following vapour pressure composition graph. Hence,
Avapour pressure of A = SZBvapour pressure of B= ZYCvapour pressure of B = SYDvapour pressure of solution at X=SZ+SY - Question 3 - Select One
Vapor pressure of a liquid changes with …… of the liquid.
AvolumeBsurface areaCtemperatureDall of these
Vapour Pressure and Boiling Point Composition Curves || Concept OF Distillation
View SolutionRaoult’s Law for a Solution of Two Miscible Liquid || Vapour Pressure and Liquid Composition Curve || Calculation of Mole Fraction in Vapour Phase
View SolutionVapor pressure of a liquid decreases with increases in ........
View SolutionLiquid and Vapor Composition Curve for Ideal Solution || Variation OF Composition OF Liquid and Vapors With External Pressure
View SolutionFor a binary ideal liquid solution, the total vapour of the solution is given as:
View Solution

