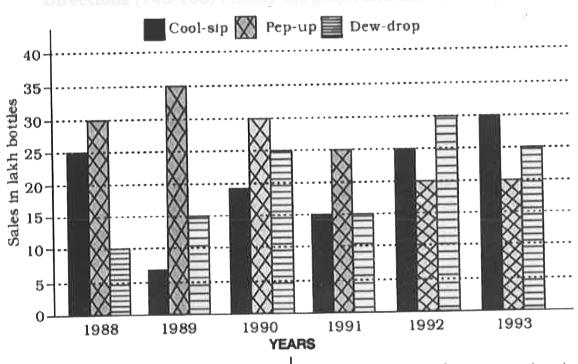
Study the graph and answer the questions.
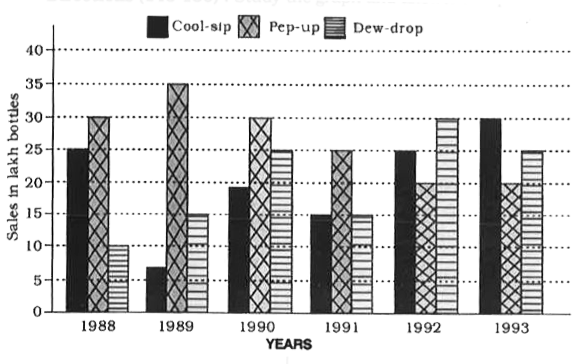
In which year the sale of coolsip is minimum?
2000
2001
2002
2004
The correct Answer is:C
Step by step video, text & image solution for Study the graph and answer the questions. In which year the sale of coolsip is minimum? by Maths experts to help you in doubts & scoring excellent marks in Class 14 exams.
Topper's Solved these Questions
Similar Questions
Knowledge Check
- Question 1 - Select One
Study the graph and answer the questions.
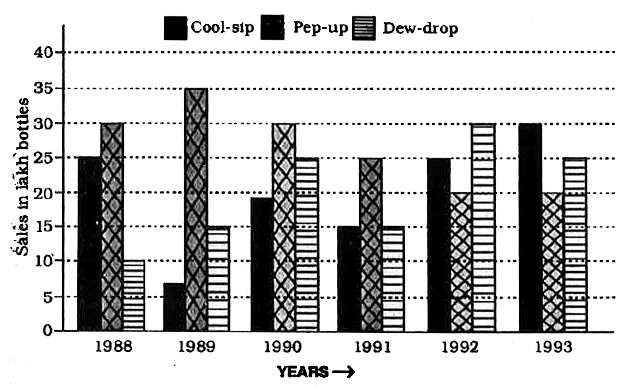
In which year the sale of cool-sip is minimum ?A1990B1992C1993DNone of the above - Question 2 - Select One
Study the graph and answer the questions.
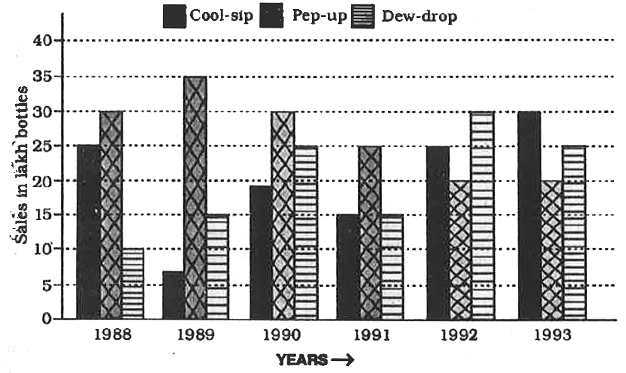
In which year sale of Drew-drop is maximum ?A1998B1992C1989D1993 - Question 3 - Select One
The subjectwise number of applicants for the year 2008 and 2009 in a college is given in the following chart. Study the graph and answer the questions.
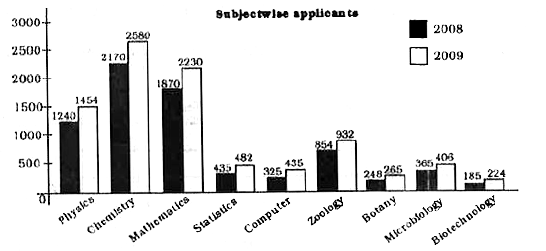
The subject for which growing of demand is minimum isAStatisticsBZoologyCBotanyDMicrobiology
Study the following graph and answer the question.
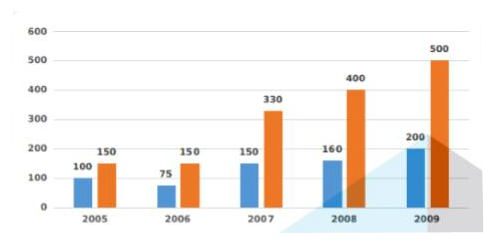
In which year was the value per tonne the minimum?View SolutionThe line graph shows the Sales per employee of a certain company. Study the diagram and answer the following questions.
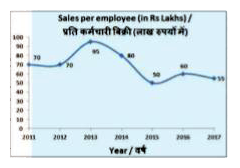
In which year were the Sales per employee greater than that of the previous year?View SolutionDirections for questions : These questions are based on the following data. Read the following bar graph and answer the questions.
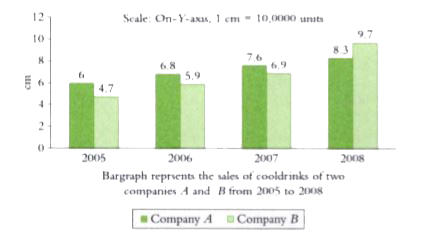
In which year is the sales of B more than the sales of A?View SolutionThe following graph gives Sales, Expenses and Capital of a company for a period of five years 1994 to 1998. Read the graph and answer the following questions.
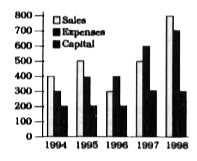
In which year was the Sales to Expense ratio the lowest?View SolutionThe line graph shows the number of vacancies for sales officers in a certain company. Study the diagram and answer the following questions.
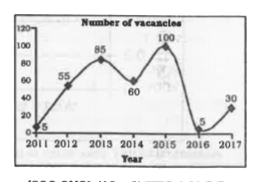
In which year was the number of vacancies less than that of the previous year?View Solution


