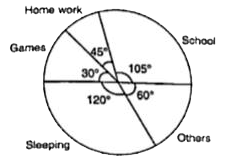
The following pie chart shows the hourly distribution (in degrees) of all the major activities of a student.
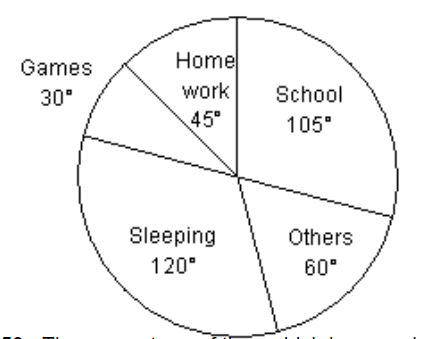
If he spends 13 rd time of homework in Mathematics then the no, of hours spends in rest of the subjects in homework
1
2
3
4
The correct Answer is:B
Step by step video, text & image solution for The following pie chart shows the hourly distribution (in degrees) of all the major activities of a student.If he spends 1/3 rd time of homework in Mathematics then the no, of hours spends in rest of the subjects in homework by Maths experts to help you in doubts & scoring excellent marks in Class 14 exams.
Topper's Solved these Questions
Similar Questions
The following pie-chart shows the monthly expenditure of a man on various items. If he spends Rs. 16,000 per month, answer the following questions.
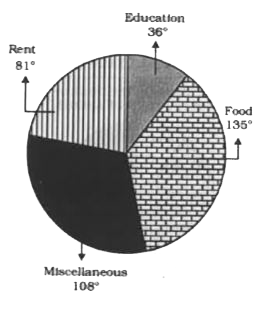
The amount he spends on education is:View SolutionThe following pie-chart shows the monthly expenditure of a man on various items. If he spends Rs. 16,000 per month, answer the following questions.
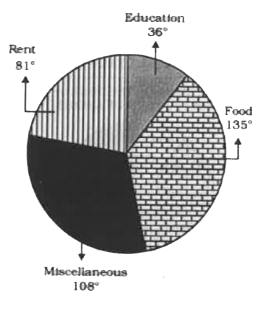
How much more does he spend on rent as compared to education ?View Solution
Knowledge Check
- Question 1 - Select One
The following pie chart shows the hourly distribution of all the major activities of a student.
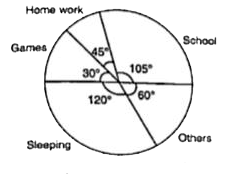
If he spends 13 rd time of home work in Mathematics then the no. of hours spends in rest of the subjects in home work :A1B2C3D4 - Question 2 - Select One
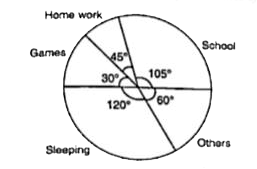
The following pie chart shows the hourly distribution of all the major activities of a student.
The percentage of time which he spends in school is :A38%B30%C40%D25% - Question 3 - Select One
The following pie chart shows the hourly distribution of all the major activities of a student.
What is the difference in time (in hours) spends in school and in home work :A2B3C4D8
The following pie-chart shows the monthly expenditure of a man on various items. If he spends Rs. 16,000 per month, answer the following questions.
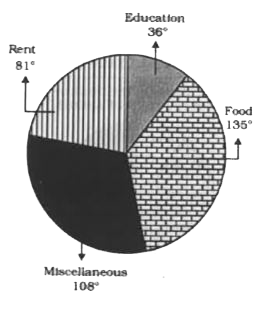
The ratio of expenses on food and rent is :View SolutionThe following pie chart shows the hourly distribution of all the major activities of a student.
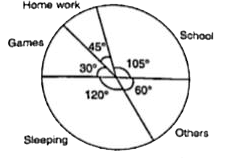
How much time (in per cent) he spends in games in comparison to sleeping ?View SolutionThe following pie chart shows the hourly distribution of all the major activities of a student.
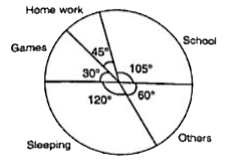
If he spends the time in games equal to the home work and remains constant in other activities, then the percentage decrease in time of sleeping :View SolutionThe following pie-chart shows the study-time of different subjects of a student in a day. Study the pie-chart and answer the following questions
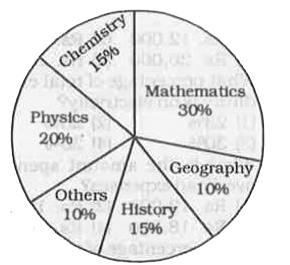
Instead of 10%, if the student spends 15% of study other subjects and the time is taken from the time scheduled to study mathematics and if he / she used to study 20 hours per day, then the difference of time for studying mathematics per day is :View SolutionThe following pie chart shows the distribution of expenses (in degrees) of a family during 2016. Total income of the family in 2016 = Rs. 1080000
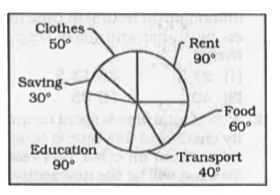
How much do they spend (in Rs.) on clothes?View Solution

