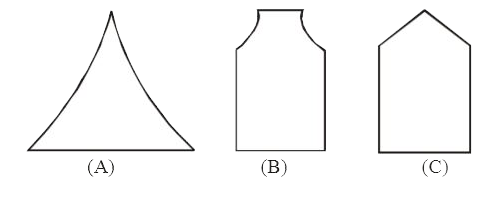
Age structure diagrams (A, B and C) for the populations are shown below. They represent:-

A
A-Declining populations
B- Stable population
C- Growing population
B
A-Growing population
B- Stationary population
C- Declining populations
C
A-Exponential growth
B- Indeterminate growth
C- Stationary population
D
A-Growing population
B- and C- Stable population
Text Solution
The correct Answer is:D
|
Updated on:21/07/2023
Similar Questions
Knowledge Check
- Question 1 - Select One
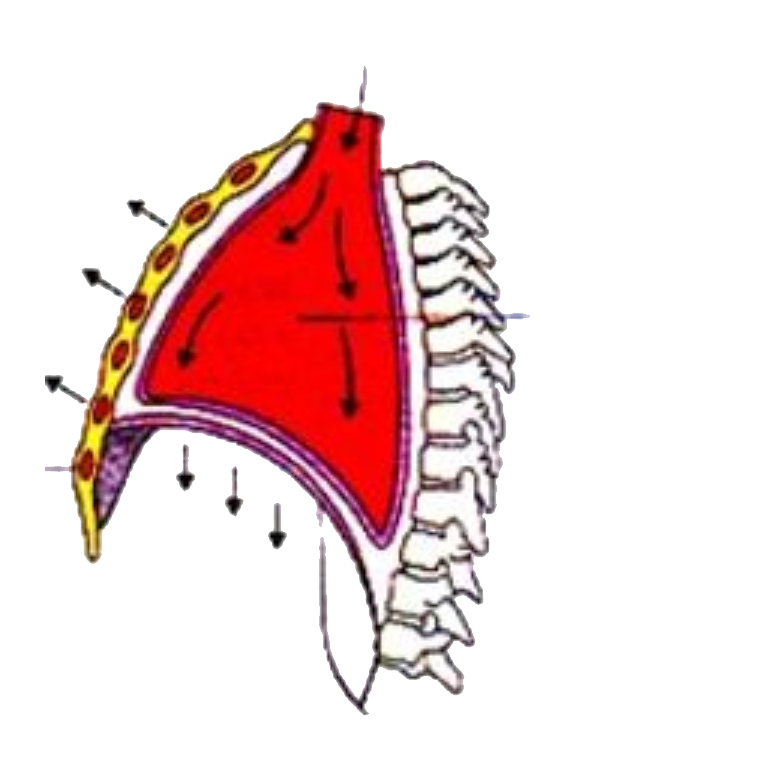
The diagram given below represents
 AinspirationBexpirationCSystoleDdiastole
 - Question 2 - Select One
An urn shaped population age pyramid represents
Agrowing populationBstatic populationCdeclining populationDextinct population - Question 3 - Select One
An urn shaped population age pyramid represents
Agrowing populationBstatic populationCdeclining populationDextinct population
An urn shaped population age pyramid represents
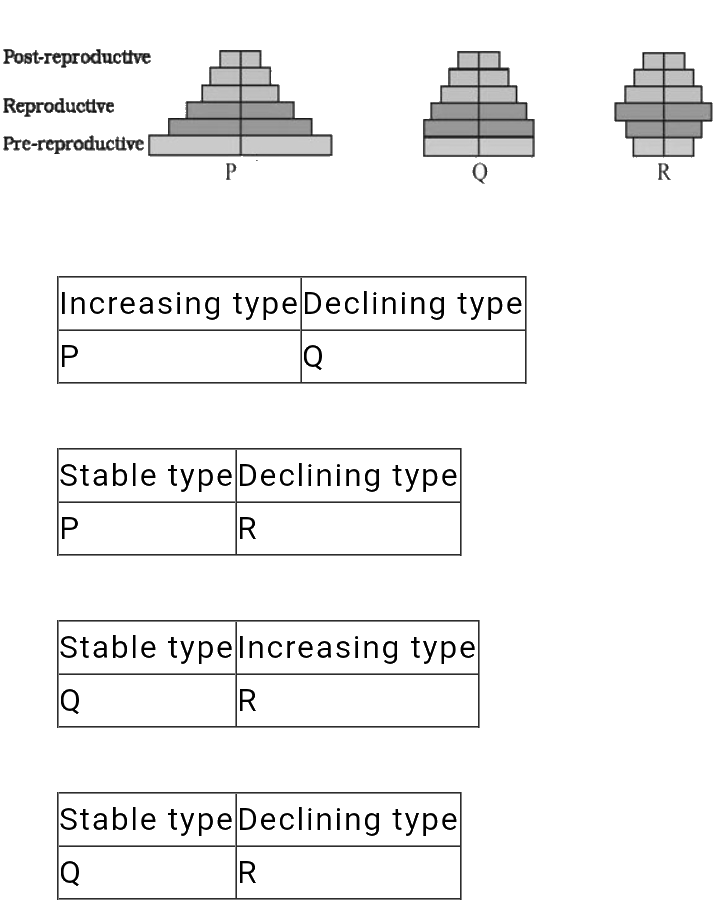
View SolutionVarious age pyramids (P-R) for human population are shown below. Select the option with correct identification.
 View Solution
Various age pyramids (P-R) for human population are shown below. Select the option with correct identification.
 View Solution
An urn shaped population age pyramid represents
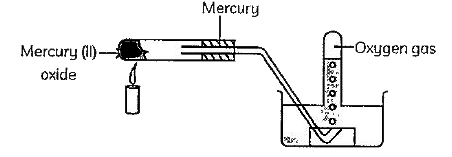
View SolutionGiven below diagram is representing :-
 View Solution

