On the basis of graph shown answer the following questions :
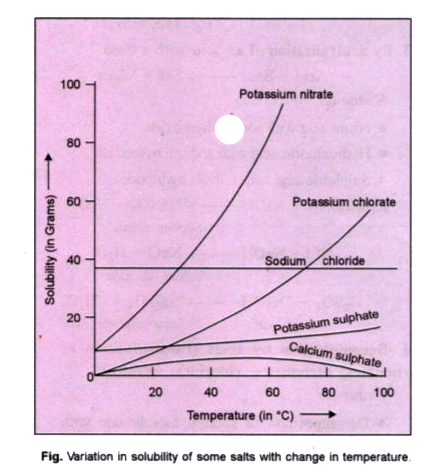
A salt whose solubility remains constant.
.....................
Step by step video & image solution for On the basis of graph shown answer the following questions : A salt whose solubility remains constant. ..................... by Chemistry experts to help you in doubts & scoring excellent marks in Class 10 exams.
Updated on:21/07/2023Topper's Solved these Questions
- STUDY OF ACIDS, BASES AND SALTSBOOK - ICSECHAPTER - STUDY OF ACIDS, BASES AND SALTSEXERCISE - WORKSHEET-5
19 Videos
- STUDY OF ACIDS, BASES AND SALTSBOOK - ICSECHAPTER - STUDY OF ACIDS, BASES AND SALTSEXERCISE - Additional Questions for Practice
41 Videos
- STUDY OF ACIDS, BASES AND SALTSBOOK - ICSECHAPTER - STUDY OF ACIDS, BASES AND SALTSEXERCISE - WORKSHEET-3
17 Videos
- SPECIMEN QUESTION PAPER (CHEMISTRY)BOOK - ICSECHAPTER - SPECIMEN QUESTION PAPER (CHEMISTRY)EXERCISE - Questions
40 Videos
- STUDY OF COMPOUNDS - AMMONIA BOOK - ICSECHAPTER - STUDY OF COMPOUNDS - AMMONIA EXERCISE - UNIT TEST PAPER 7B - AMMONIA
22 Videos
Similar Questions
On the basis of graph shown answer the following questions :
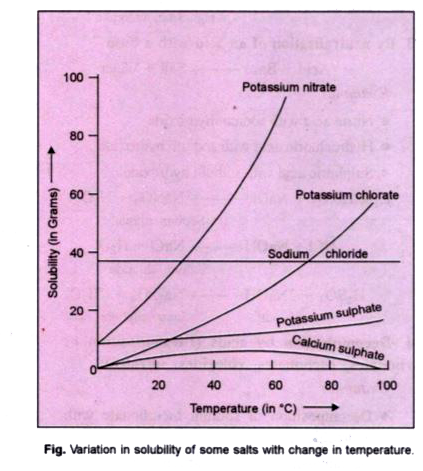
A salt whose solubility first increase and then decrease.
.....................
View SolutionOn the basis of graph shown answer the following questions :
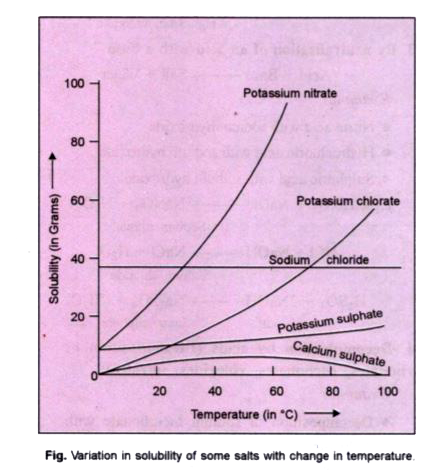
A salt whose solubility increases with increase in temperature.
....................
View Solution
Knowledge Check
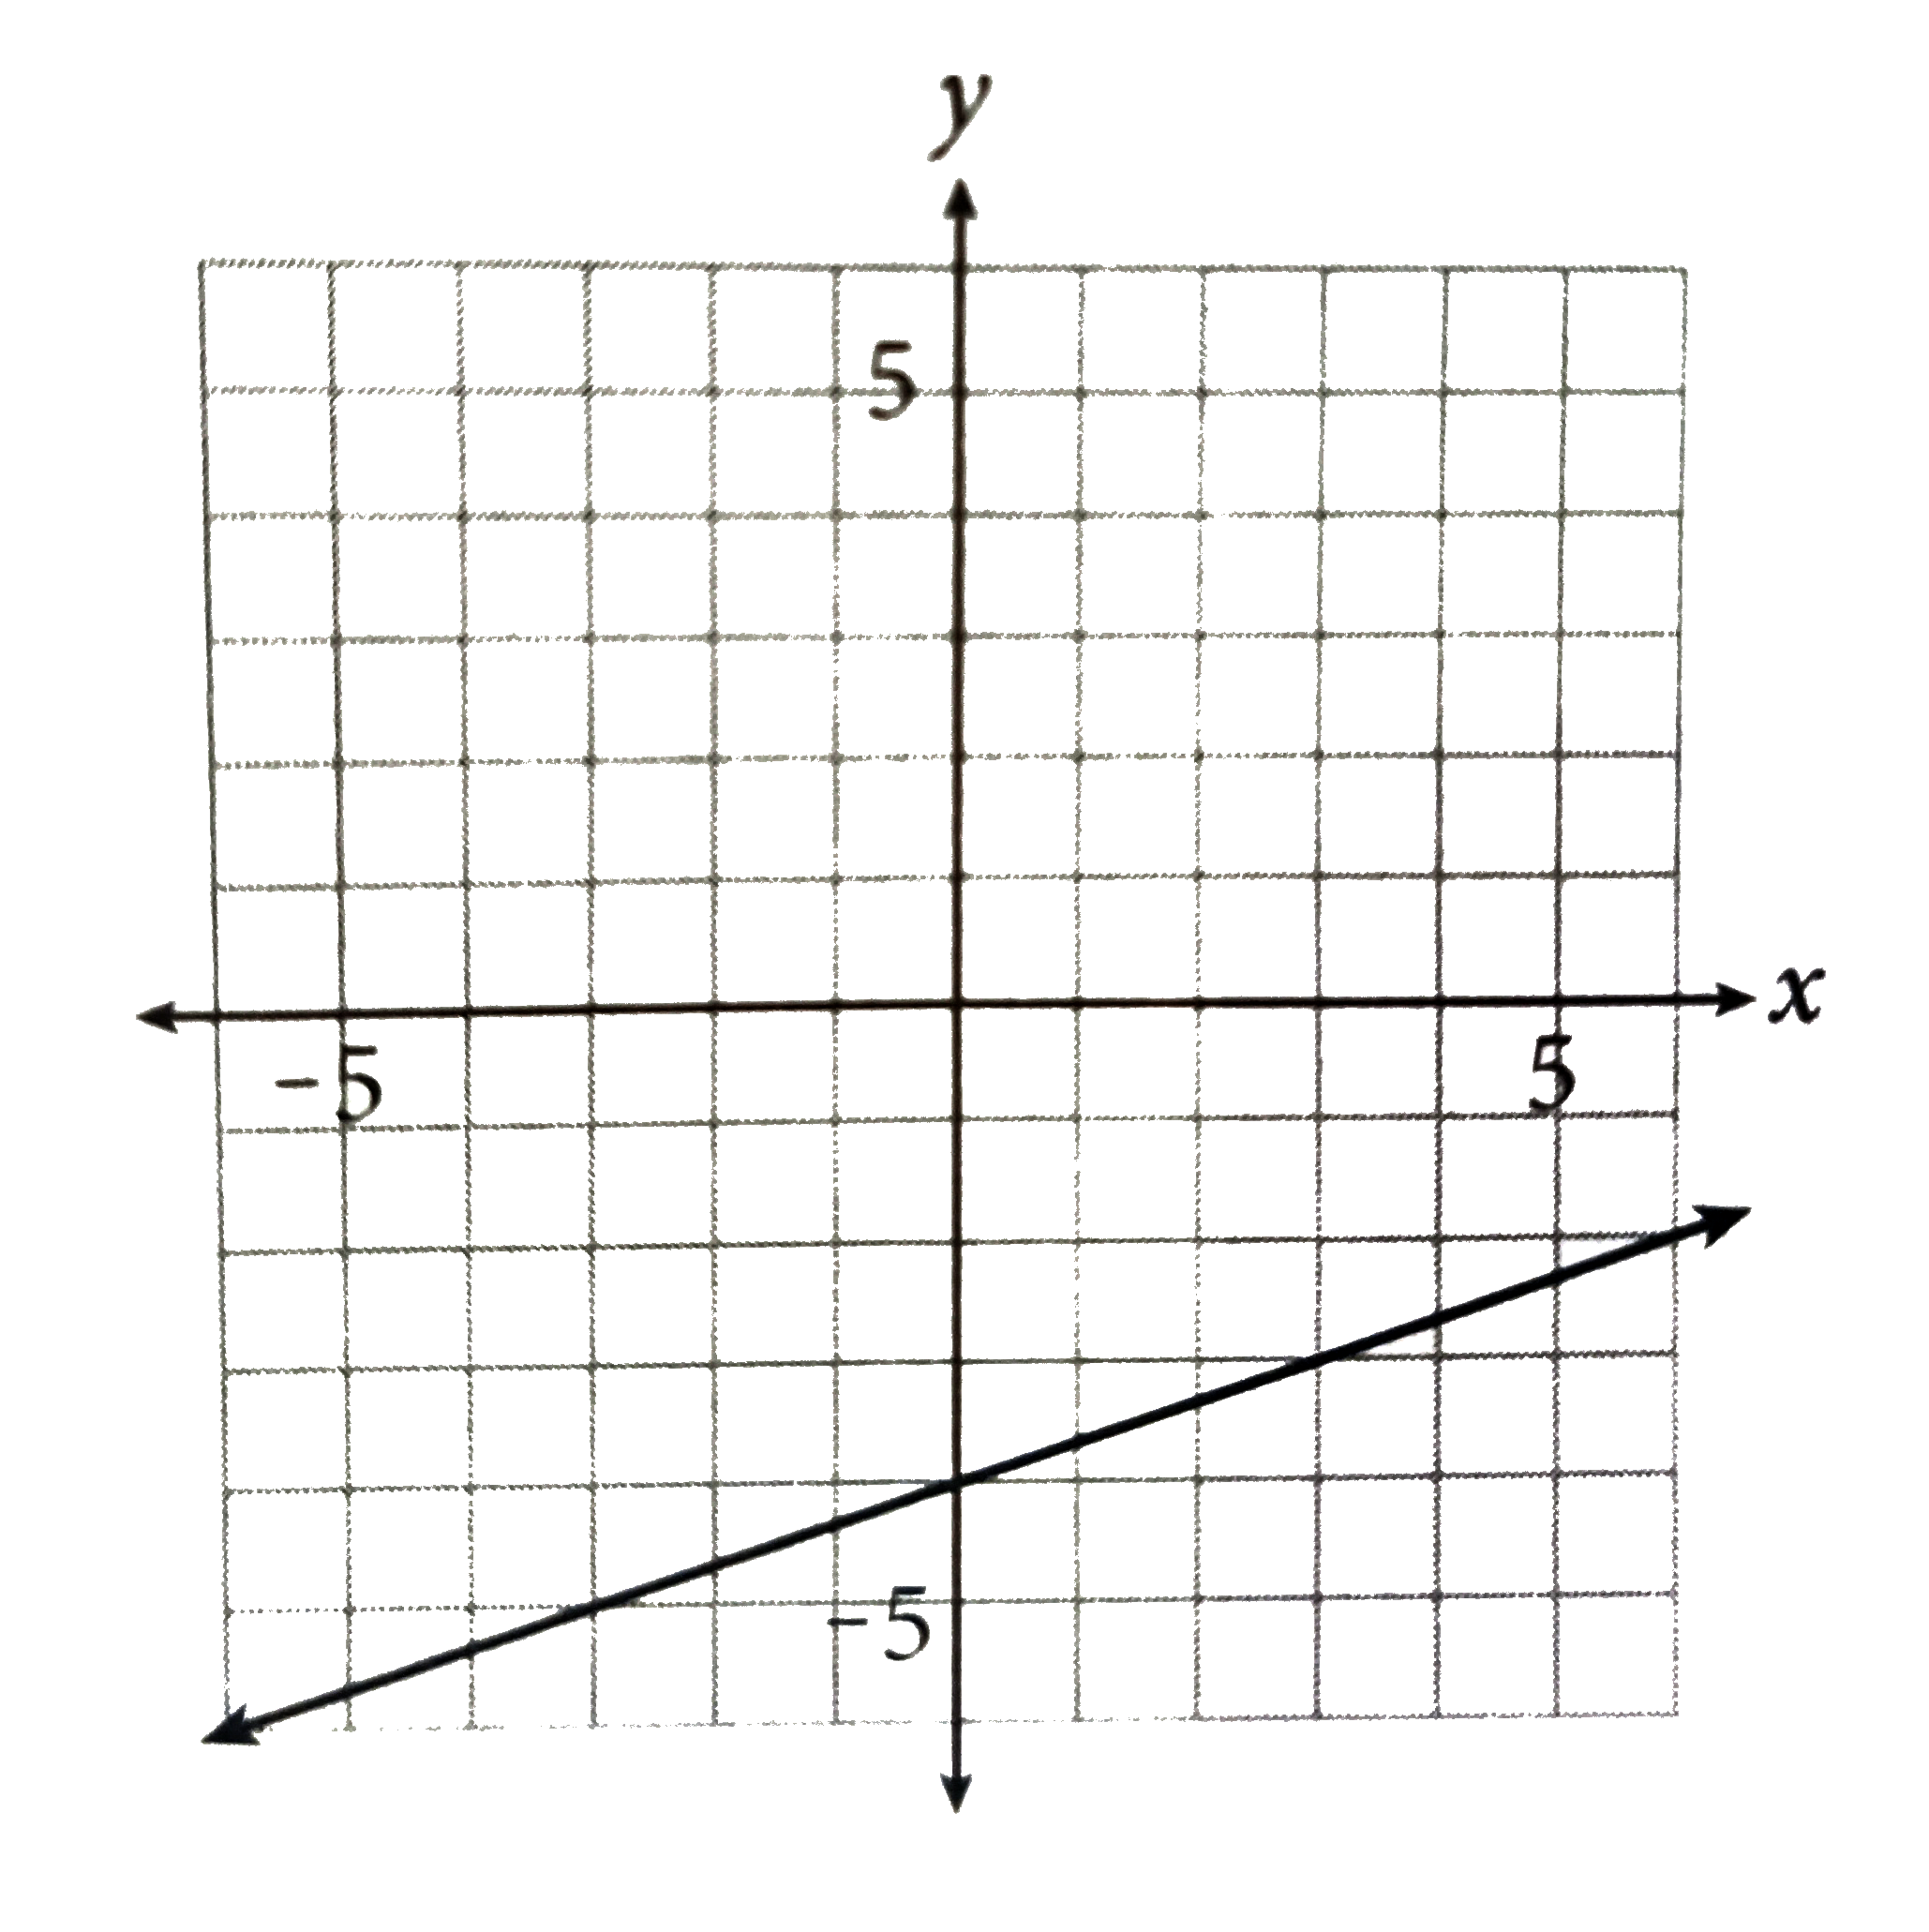
The graph shown represents which of the following equations ?Ay=−3x+4By=−13x+4Cy=13x−4Dy=3x−4Study the map and answer the following question:
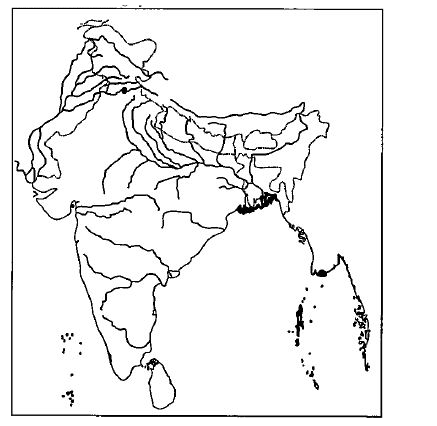
Identify the dam which is shown in the map.AHirakudBBhakra NangalCTehriDRihandStudy the map and answer the following questions:
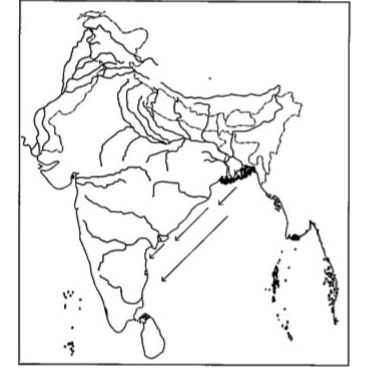
Identify the winds which are shown in the mapATropical cyclonesBRetreating South-West MonsoonCWestern DisturbancesDSouth-West Monsoon
In the V-T graph shown in figure match the following.
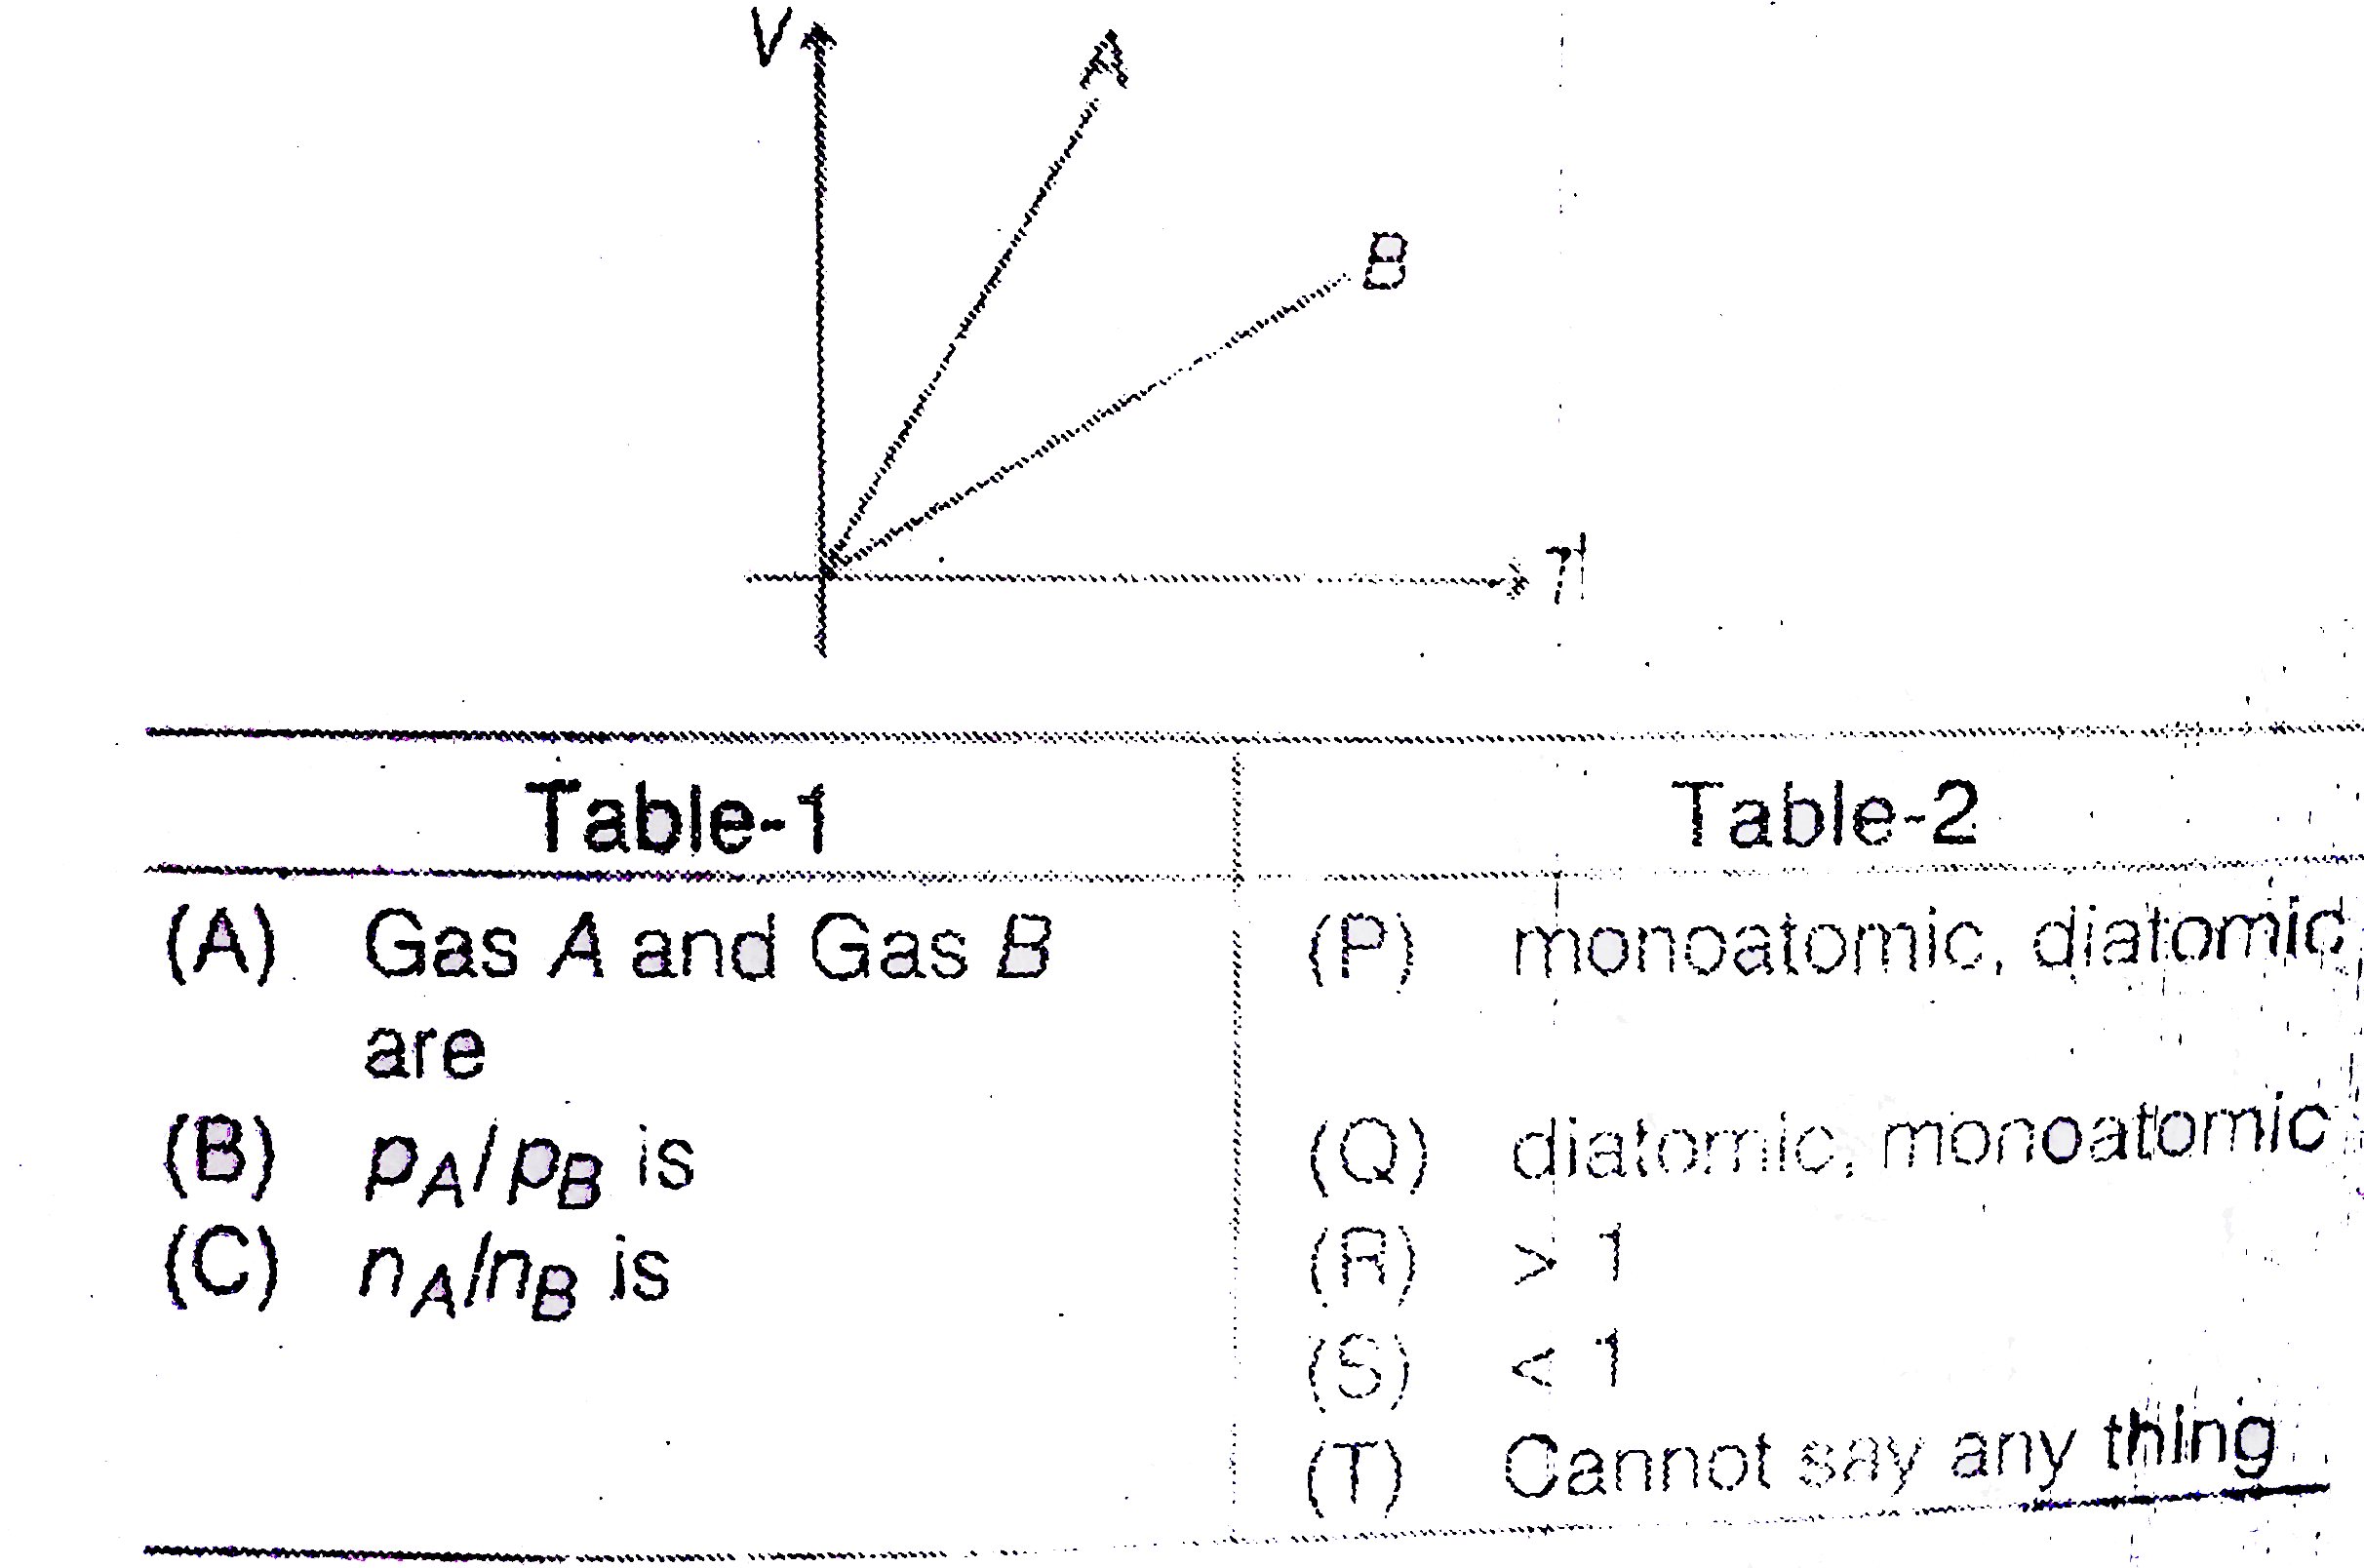
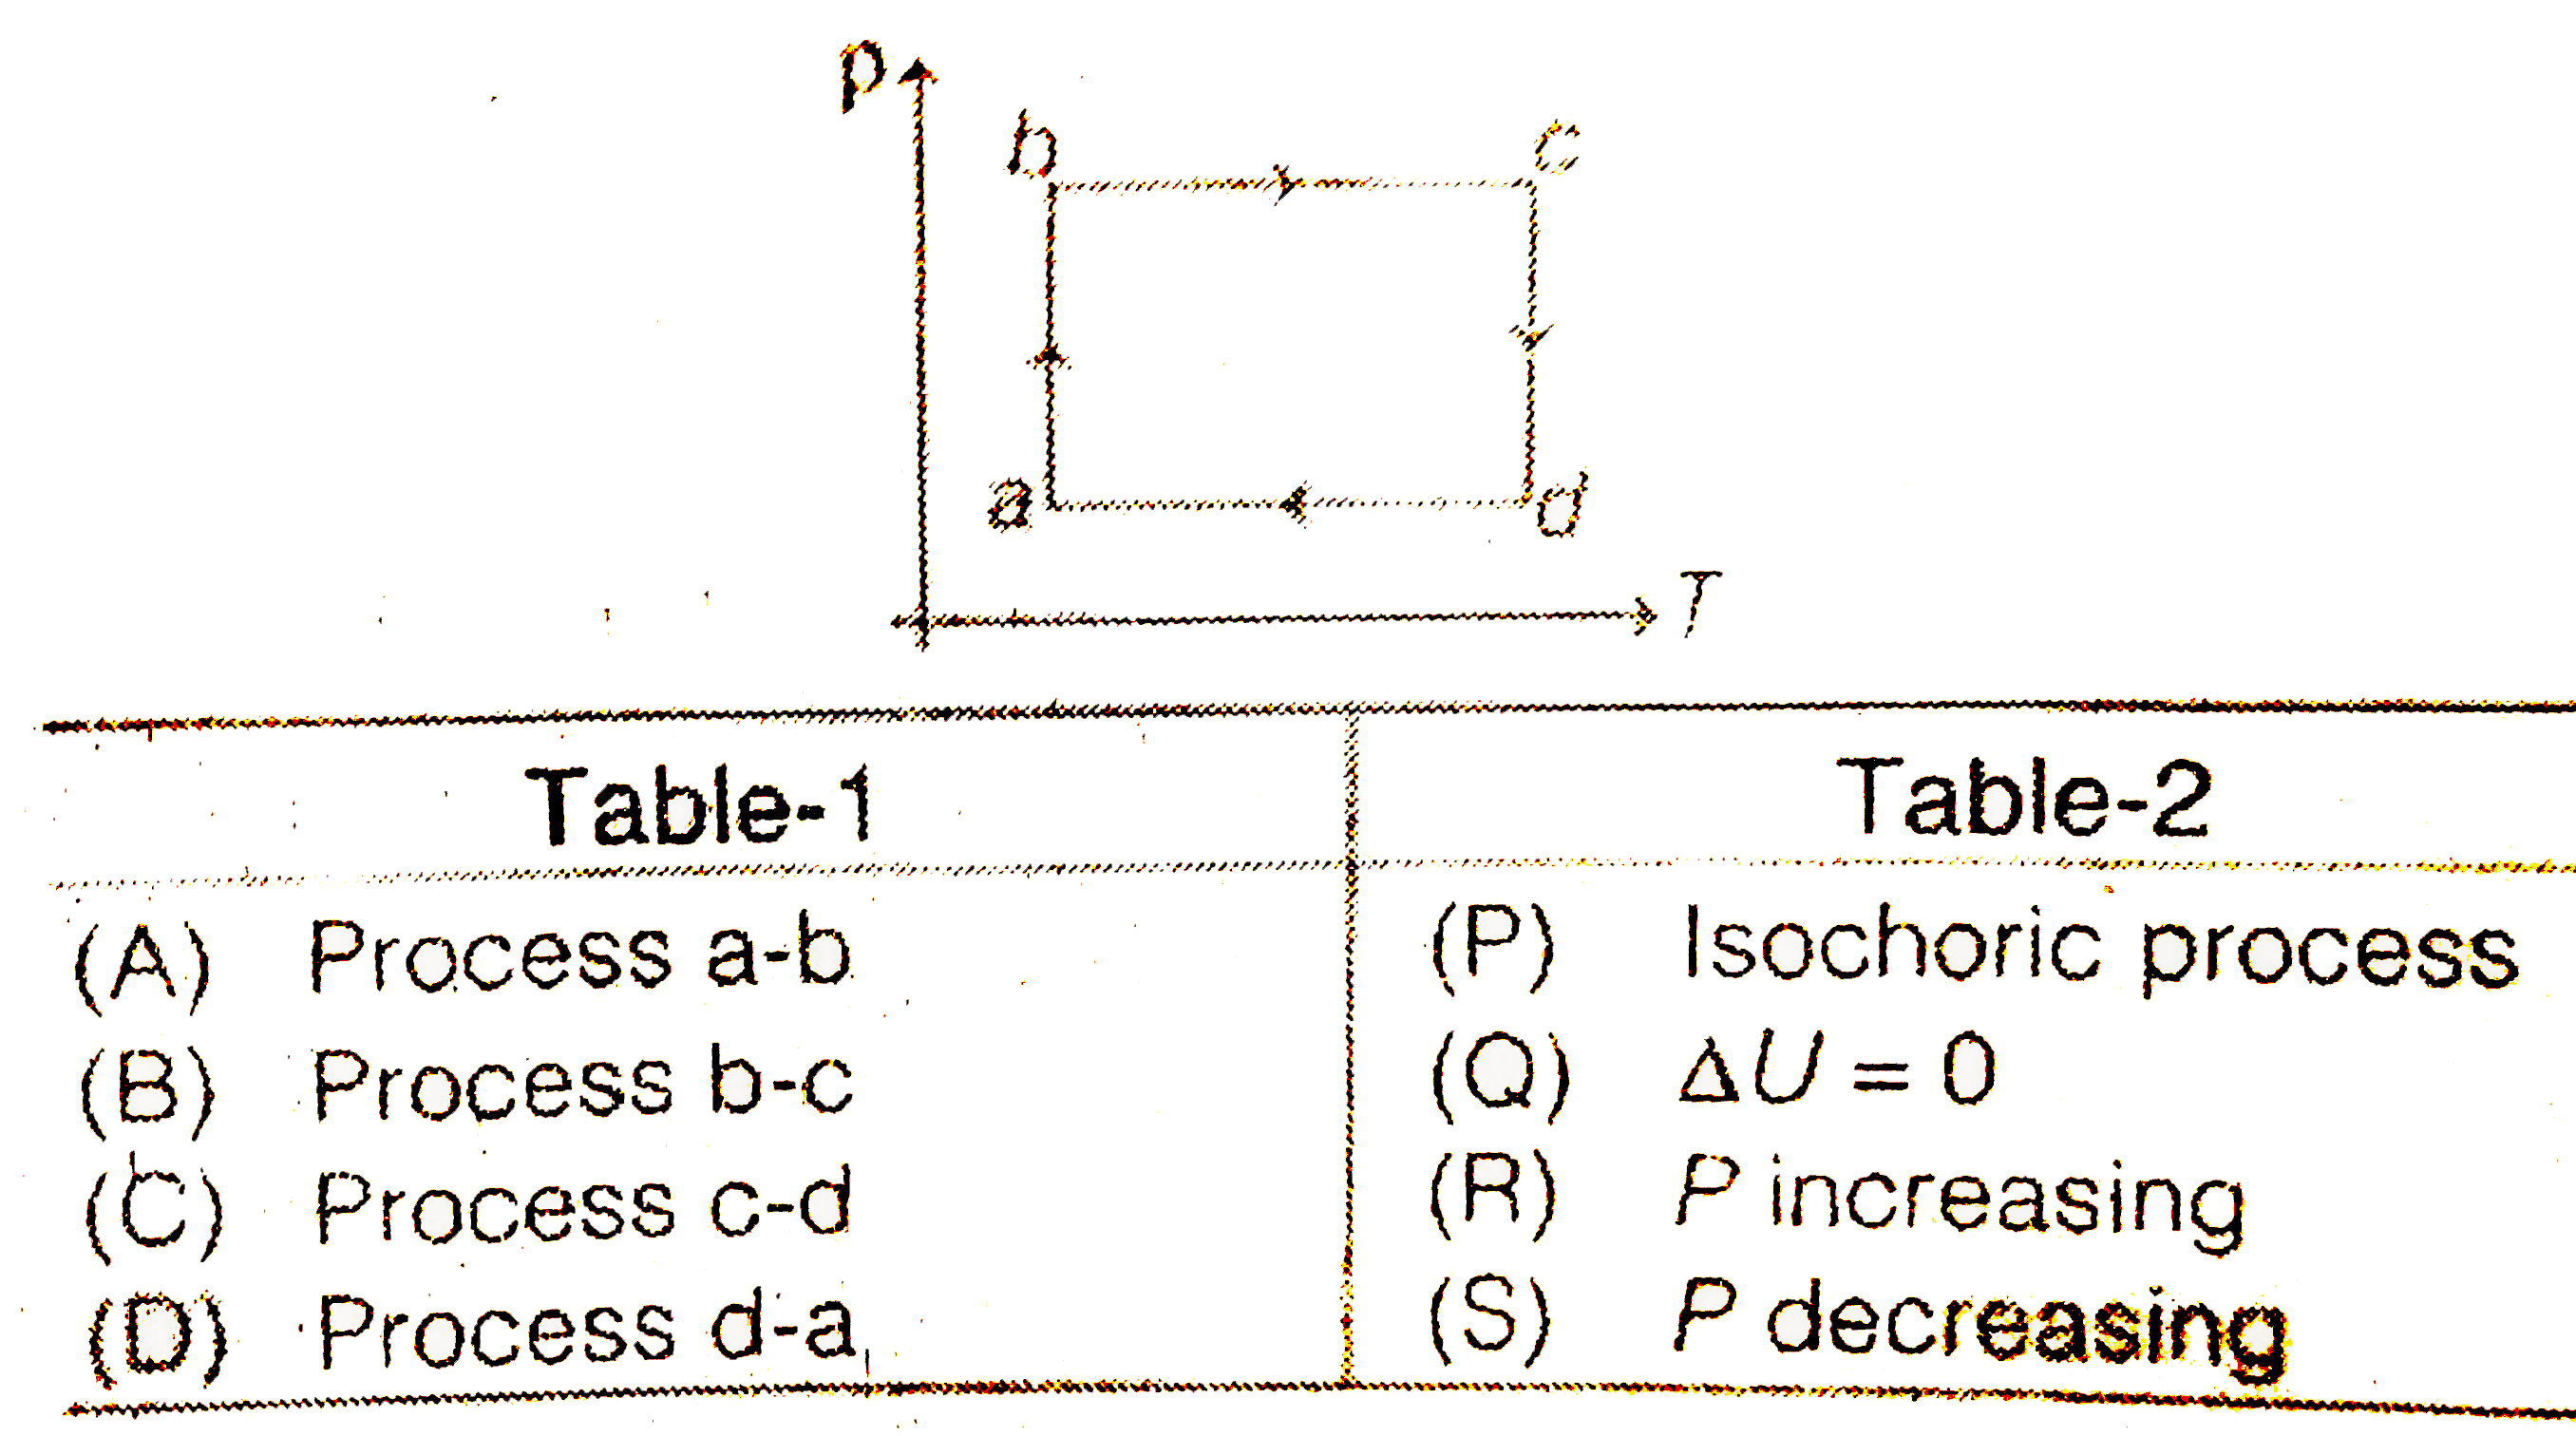
View SolutionIn the ρ-T graph shown in figure, match the following.
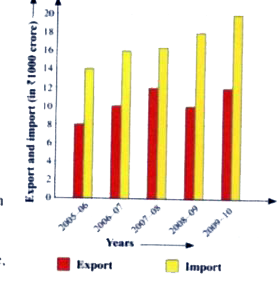
View SolutionRead the bar graph and answer the following questions.
What information is given by the bar graph?
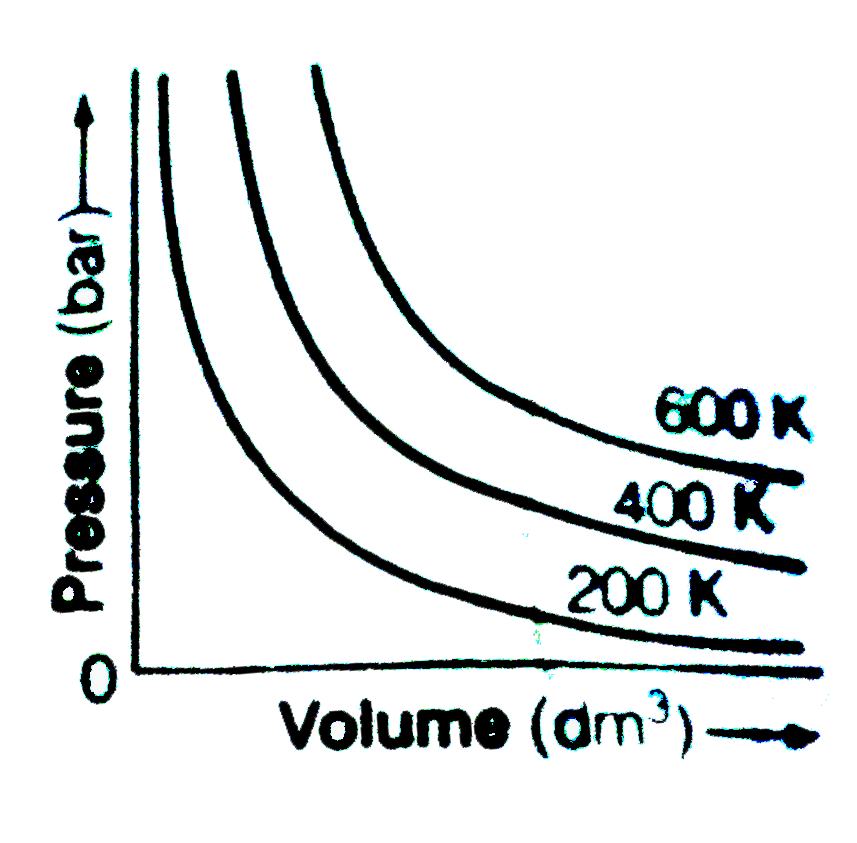
View SolutionThe variation of pressure with volume of the gas at different temperatures can be graphically represented as shown in figure. On the basis of this graph answer the following question.
(i) How will the volume of a gas change if its pressure is increased at constant temperature ?
(ii) At a constant pressure, how will the volume of a gas change if the temperature is increased from 200 K to 400 K ?
View SolutionStudy the map and answer the following question:
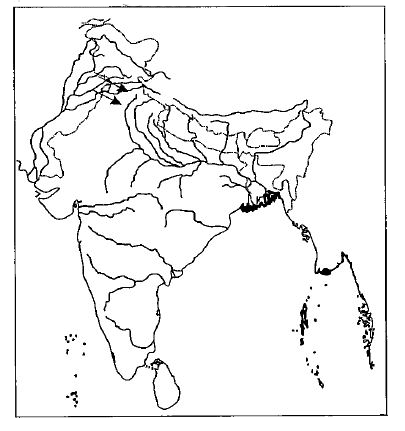
Identify the winds which are shown in the map.
View Solution
