एक मोहल्ले के 20 परिवारों पर किए गए सर्वेक्षण के परिणाम स्वरूप विभिन्न परिवेश के सदस्यों की संख्या निम्न है:

उन आकड़ों से संक्षिप्त विधि से समांतर माध्य ज्ञात कीजिए।
Step by step video & image solution for एक मोहल्ले के 20 परिवारों पर किए गए सर्वेक्षण के परिणाम स्वरूप विभिन्न परिवेश के सदस्यों की संख्या निम्न है: उन आकड़ों से संक्षिप्त विधि से समांतर माध्य ज्ञात कीजिए। by Maths experts to help you in doubts & scoring excellent marks in Class 10 exams.
Updated on:21/07/2023Topper's Solved these Questions
- MODEL PAPER 2021BOOK - MP BOARD - PREVIOUS YEAR PAPERSCHAPTER - MODEL PAPER 2021EXERCISE - प्रायिकता
62 Videos
- MODEL PAPER 2021BOOK - MP BOARD - PREVIOUS YEAR PAPERSCHAPTER - MODEL PAPER 2021EXERCISE - त्रिकोणमिति का परिचय
6 Videos
- BOARD 2020BOOK - MP BOARD - PREVIOUS YEAR PAPERSCHAPTER - BOARD 2020EXERCISE - All Questions
62 Videos
- अनसॉल्वड पेपर्स (2011)BOOK - MP BOARD - PREVIOUS YEAR PAPERSCHAPTER - अनसॉल्वड पेपर्स (2011)EXERCISE - गणित
46 Videos
Similar Questions
जो घटनाएं घटित नहीं होती है उसकी प्रायिकता क्या होगी।
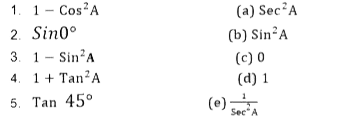
View Solutionसही जोड़ी बनाइये

View Solutionजब हो तो समीकरण निकाय(a1÷a2=b1÷b2=c1÷c2)तथा (a1X+b1Y+C1Z=0) तथा
View Solutionसही विकल्प चुनकर अपनी उत्तर-पुस्तिका में लिखिए-
दो युगपत् रैखिक समीकरणों a1x+b1y+c1=0 एवं a2x+b2y+c2=0 का एक हल होगा, यदि-
View SolutionIdentify the cell organelle 'A' :-
ltimg src="https://d10lpgp6xz60nq.cloudfront.net/physics_images/ALN_BIO_C10_E08_018_Q01.png" width="80%"gt
View SolutionHow many lines of symmetry does the above figure have ?
View SolutionWhich of the following are correct chain isomers of butane ? (i)
View SolutionDetermine the point of symmetry of a regular hexagon.
View SolutionDtermine the images of the following figure about the given line :
View SolutionMatch the following Column A to Column B

View SolutionMatch the following Column A to Column B

View SolutionMatch the following Column A to Column B

View SolutionThe inequation represented by the graph given below is :
View SolutionThe inequation that best describes the graph given below is _________
View SolutionThe inequation that best describes the following graph is _________
View SolutionWhich inequations represent the shaded region in the given figure
View Solution
