ਚਿੱਤਰ 6.29 ਵਿਚ, ਜੇ AB || CD, CD || EF ਅਤੇ y : z = 3 : 7 ਹੈ ਤਾਂ x ਦਾ ਮੁੱਲ ਪਤਾ ਕਰੋ।

Step by step video & image solution for ਚਿੱਤਰ 6.29 ਵਿਚ, ਜੇ AB || CD, CD || EF ਅਤੇ y : z = 3 : 7 ਹੈ ਤਾਂ x ਦਾ ਮੁੱਲ ਪਤਾ ਕਰੋ। by Maths experts to help you in doubts & scoring excellent marks in Class 9 exams.
Updated on:21/07/2023Topper's Solved these Questions
- ਰੇਖਾਵਾਂ ਅਤੇ ਕੋਣBOOK - PSEB (PUNJABI MEDIUM)CHAPTER - ਰੇਖਾਵਾਂ ਅਤੇ ਕੋਣEXERCISE - EXAMPLE
6 Videos
- ਯੂਕਲਿਡ ਦੀ ਜਮਾਇਤੀ ਦੀ ਜਾਣ-ਪਛਾਣBOOK - PSEB (PUNJABI MEDIUM)CHAPTER - ਯੂਕਲਿਡ ਦੀ ਜਮਾਇਤੀ ਦੀ ਜਾਣ-ਪਛਾਣEXERCISE - EXAMPLE
1 Videos
- ਸਤ੍ਹਈ ਖੇਤਰਫਲ ਅਤੇ ਆਇਤਨBOOK - PSEB (PUNJABI MEDIUM)CHAPTER - ਸਤ੍ਹਈ ਖੇਤਰਫਲ ਅਤੇ ਆਇਤਨEXERCISE - EXAMPLE
1 Videos
Similar Questions
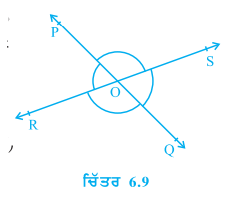
ਚਿੱਤਰ 6.9 ਵਿੱਚ, ਰੇਖਾਵਾਂ PQ ਅਤੇ RS ਆਪਸ ਵਿੱਚ ਬਿੰਦੂ O 'ਤੇ ਕੱਟਦੀਆਂ ਹਨ। ਜੇ ∠POR:∠ROQ=5:7 ਹੈ, ਤਾਂ ਸਾਰੇ ਕੋਣਾਂ ਦਾ ਮੁੱਲ ਪਤਾ ਕਰੋ।

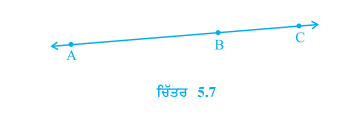
View Solutionਜੇ A,B ਅਤੇ C ਇਕ ਰੇਖਾ 'ਤੇ ਸਥਿਤ ਤਿੰਨ ਬਿੰਦੂ ਹਨ ਅਤੇ B ਬਿੰਦੂਆਂ A ਅਤੇ C ਦੇ ਵਿਚਾਲੇ ਸਥਿਤ ਹੈ(ਦੇਖੋ ਚਿੱਤਰ 5.7), ਤਾਂ ਸਿੱਧ ਕਰੋ ਕਿ AB+BC=AC ਹੈ।

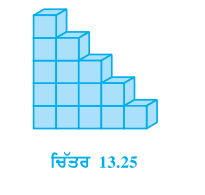
View Solutionਇਕ ਬੱਚਾ ਭਵਨ ਬਲਾਕਾਂ ਨਾਲ ਖੇਡ ਰਿਹਾ ਹੈ ਜਿਹੜੇ ਇਕ ਘਣ ਅਕਾਰ ਦੇ ਹਨ। ਉਸ ਨੇ ਚਿਤਰ 13.25 ਵਿੱਚ ਦਰਸਾਏ ਅਨੁਸਾਰ ਇਕ ਢਾਂਚਾ ਬਣਾਇਆ ਹੈ। ਹਰੇਕ ਘਣ ਦਾ ਕਿਨਾਰਾ 3 ਸਮ ਹੈ। ਉਸ ਬੱਚਾ ਦੁਆਰਾ ਬਣਾਏ ਗਏ ਢਾਂਚੇ ਦਾ ਆਇਤਨ ਪਤਾ ਕਰੋ

View SolutionIn the given figure (not to scale), O is the centre of the circle. A,B,C and D are concyclic and AB=CD . If /_MON =120^(@) , then find /_ OPN .
View SolutionHow many lines of symmetry does the above figure have ?
View SolutionWhich of the following are correct chain isomers of butane ? (i)
View SolutionDetermine the point of symmetry of a regular hexagon.
View SolutionDtermine the images of the following figure about the given line :
View SolutionIn the figure above (not to scale), ¯¯¯¯¯¯AB⊥¯¯¯¯¯¯CDandAD is the bisector of ∠BAE.AB=3cm and AC=5cm. Find CD.
View SolutionMatch the following Column A to Column B

View SolutionMatch the following Column A to Column B

View SolutionMatch the following Column A to Column B

View SolutionThe inequation represented by the graph given below is :
View SolutionThe inequation that best describes the graph given below is _________
View SolutionThe inequation that best describes the following graph is _________
View SolutionWhich inequations represent the shaded region in the given figure
View Solution
