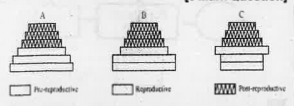
Given above is the bar diagram showing age structure of three different populations. Observe the diagram carefully and answer the following questions.
Select the stable population.
B. stable population
Topper's Solved these Questions
Similar Questions
Given below is the diagram of an experiment just at the start. Study the diagram carefully and answer the following questions :

Redraw the diagram to show the result of the experiment after a few hours.
View SolutionGiven below is a bar graph showing the heights of six mountain peaks.
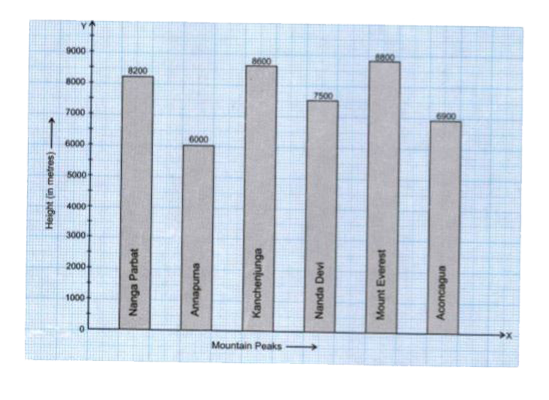
Read the above bar diagram and answer the following questions :
What is the highest mountain peak?
View Solution
Knowledge Check
The bar graph shows the population of different countries. Study the diagram and answer the following questions.
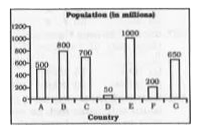
Which country has the second highest population?ABBDCEDAThe bar graph shows the population of different countries. Study the diagram and answer the following questions.
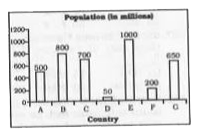
What is the ratio of population of country A to that of country G?A13:10B10:13C5:13D13:5The following bar diagram shows the percentage of Hindus, Sikhs and Muslims in a state during the years from 2004 o 2007. Examine the bar diagram and answer the following questions.
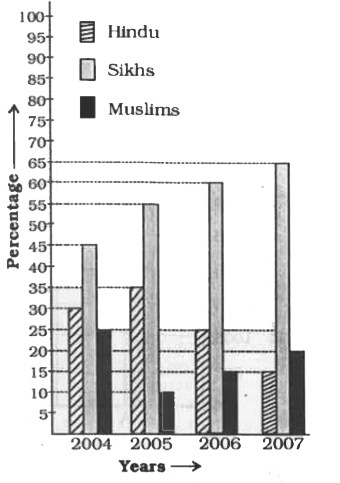
If the total population of the state in 2005 was 5 million, then the Hindu population was [1 million = 10,00,000]A2000000B1250000C1500000D1750000
With the help of suitable diagrams, explain how the age structures determine the trend of population ?
View SolutionGiven below is a bar graph showing the heights of six mountain peaks.
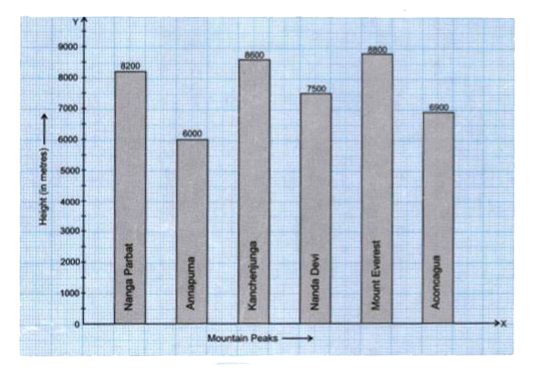
Read the above bar diagram and answer the following questions :
what is information given in the graph
View SolutionHow can age-sex structure of a population be depicted in a pyramid diagram ?
View SolutionThe following bar diagram shows the percentage of Hindus, Sikhs and Muslims in a state during the years from 2004 o 2007. Examine the bar diagram and answer the following questions.
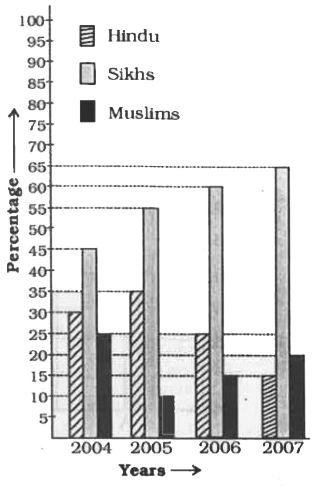
If the total population of the state in 2004 was 5 lakhs, then the Hindus and Muslims population in that year was
View SolutionThe following bar diagram shows the percentage of Hindus, Sikhs and Muslims in a state during the years from 2004 to 2007 . Examine the bar diagram and answer the following questions .
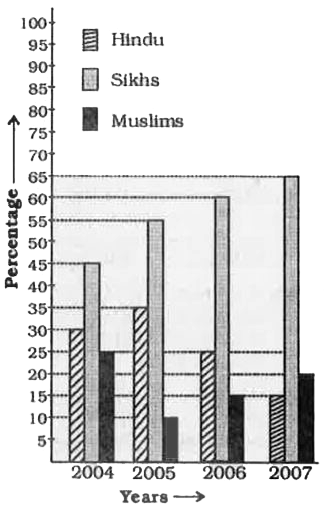
If the total population of the state in 2004 was 5 lakhs, then the Hindu and Muslim population in that year was
View Solution
