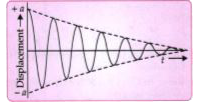
The diagram in Fig. shows the displacement time graph of a vibrating body.
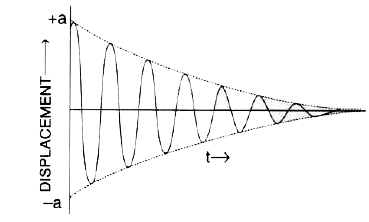
Give one example of such vibrations.
A tuning fork vibrating in air.
Topper's Solved these Questions
Similar Questions
The diagram in Fig. shows the displacement time graph of a vibrating body.
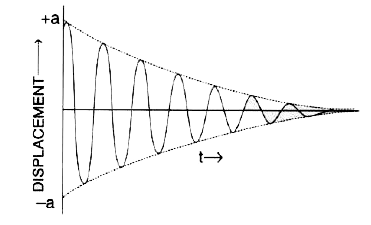
Why is the amplitude of vibrations gradually decreasing ?View SolutionGive one example of forced vibration.
View SolutionThe diagram in Fig. shows the displacement time graph of a vibrating body.
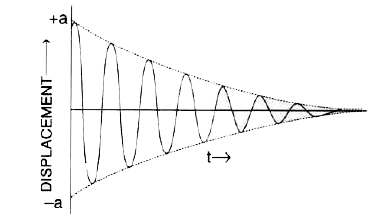
What happens to the vibrations of the body after some time?View SolutionThe diagram in Fig. shows the displacement time graph of a vibrating body.
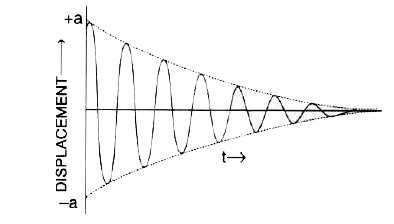
Name the kind of vibrations.View SolutionThe diagram in Fig. shows the displacement time graph of a vibrating body.

Give one example of such vibrations.View SolutionThe diagram in Fig. shows the displacement time graph of a vibrating body.

What happens to the vibrations of the body after some time?View SolutionThe diagram below shows the displacement-time graph for a vibrating body.
Name the type of vibrations produced by the vibrating body.
 View Solution
The diagram in Fig. shows the displacement time graph of a vibrating body.

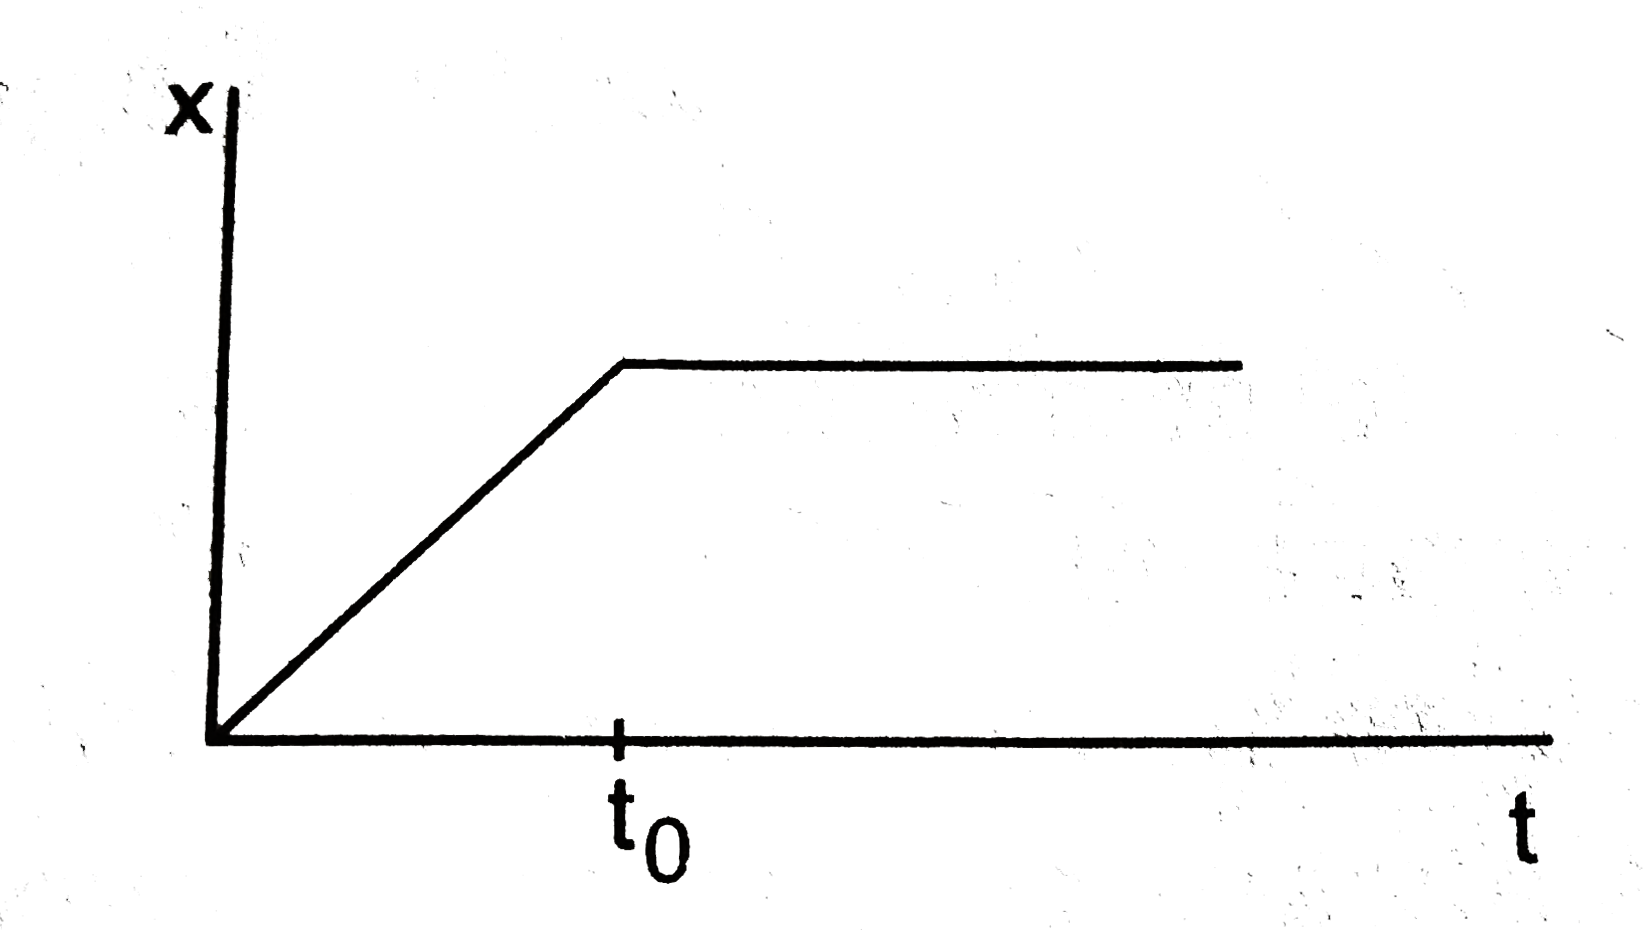
Why is the amplitude of vibrations gradually decreasing ?View SolutionFigure shows the displacement time graph of a particle moving on the X-axis
 View Solution
Figure shows the displacement-time graph of a particle moving on the X-axis
 View Solution

