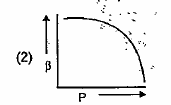
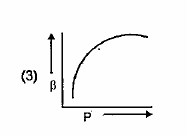
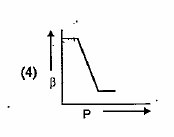
Which of the following graphs correctly represents the variation of Bη=−dv/dpv with P for n ideal gas at constant temperature ? Solution in Bengali
https://haygot.s3.amazonaws.com/choices/179862_614134.png


The correct Answer is:A
Step by step video, text & image solution for Which of the following graphs correctly represents the variation of Beta=-(dv//dp)/v with P for n ideal gas at constant temperature ? by Chemistry experts to help you in doubts & scoring excellent marks in Class 11 exams.
Topper's Solved these Questions
Similar Questions
Based upon Boyle's law draw the plot of P vs V and also PV vs P.
02:14View SolutionWhich of the following statement is incorrect?
02:27View SolutionWhich of the following graphs correctly represents the variation of β=−dV/dPV
with P for an ideal gas at constant temperature?02:35View Solutionwhich of the following graphs correctly represents the vatiation beta=-((dV)/(dP))_(T)//V with P for an ideal gas at constant temperature ? .
01:46View SolutionWhich of the following graphs correctly represents the variation of β=−(dVdP)/V with P for an ideal gas at constant temperature
02:14View SolutionWhich of following graphs correctly represent variation of alpha = (-(dV//dP)_(T))/(V) with P for fixed amount of an ideal gas at constant temperature ?
03:09View SolutionWhich of the following graphs correctly represents the variation of β=−dV/dPV
with P for an ideal gas at constant temperature?View SolutionExplain that the following graph shows the values of P for ideal gas at constant temperature. beta=-(dV//dP)//V Displays the dress.
View SolutionWhich of the following graphs correctly represents the variation of β=−(dVdP)1V with P for an ideal gas at constant temperature ?
View SolutionWhich of the following graphs correctly represent the variation of beta = -(dV//dP)/(V) with P for an ideal gas at constant temperature?
View SolutionWhich of the graphs shown below represents the variation of β=−1VdVdP with P for an ideal gas at constant temperature?
01:33View SolutionWhich of the following graphs correctly represents the variation of β=−(dV/dP)/V with P for an ideal gas at constant temperature?
View SolutionWhich of the following graphs correctly represents the variation of β=−dV/dPV
with P for an ideal gas at constant temperature?01:41View SolutionWhich of the folowing graphs correctly represent the variation of beta = (dV/dP)/V with P for an ideal gas at constant temperature?
01:49View SolutionWhich of the following graphs correctly represents the variation of β=−(dVdP)/V with P for an ideal gas at constant temperature
03:35View Solution

