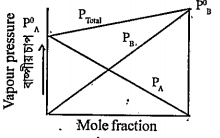
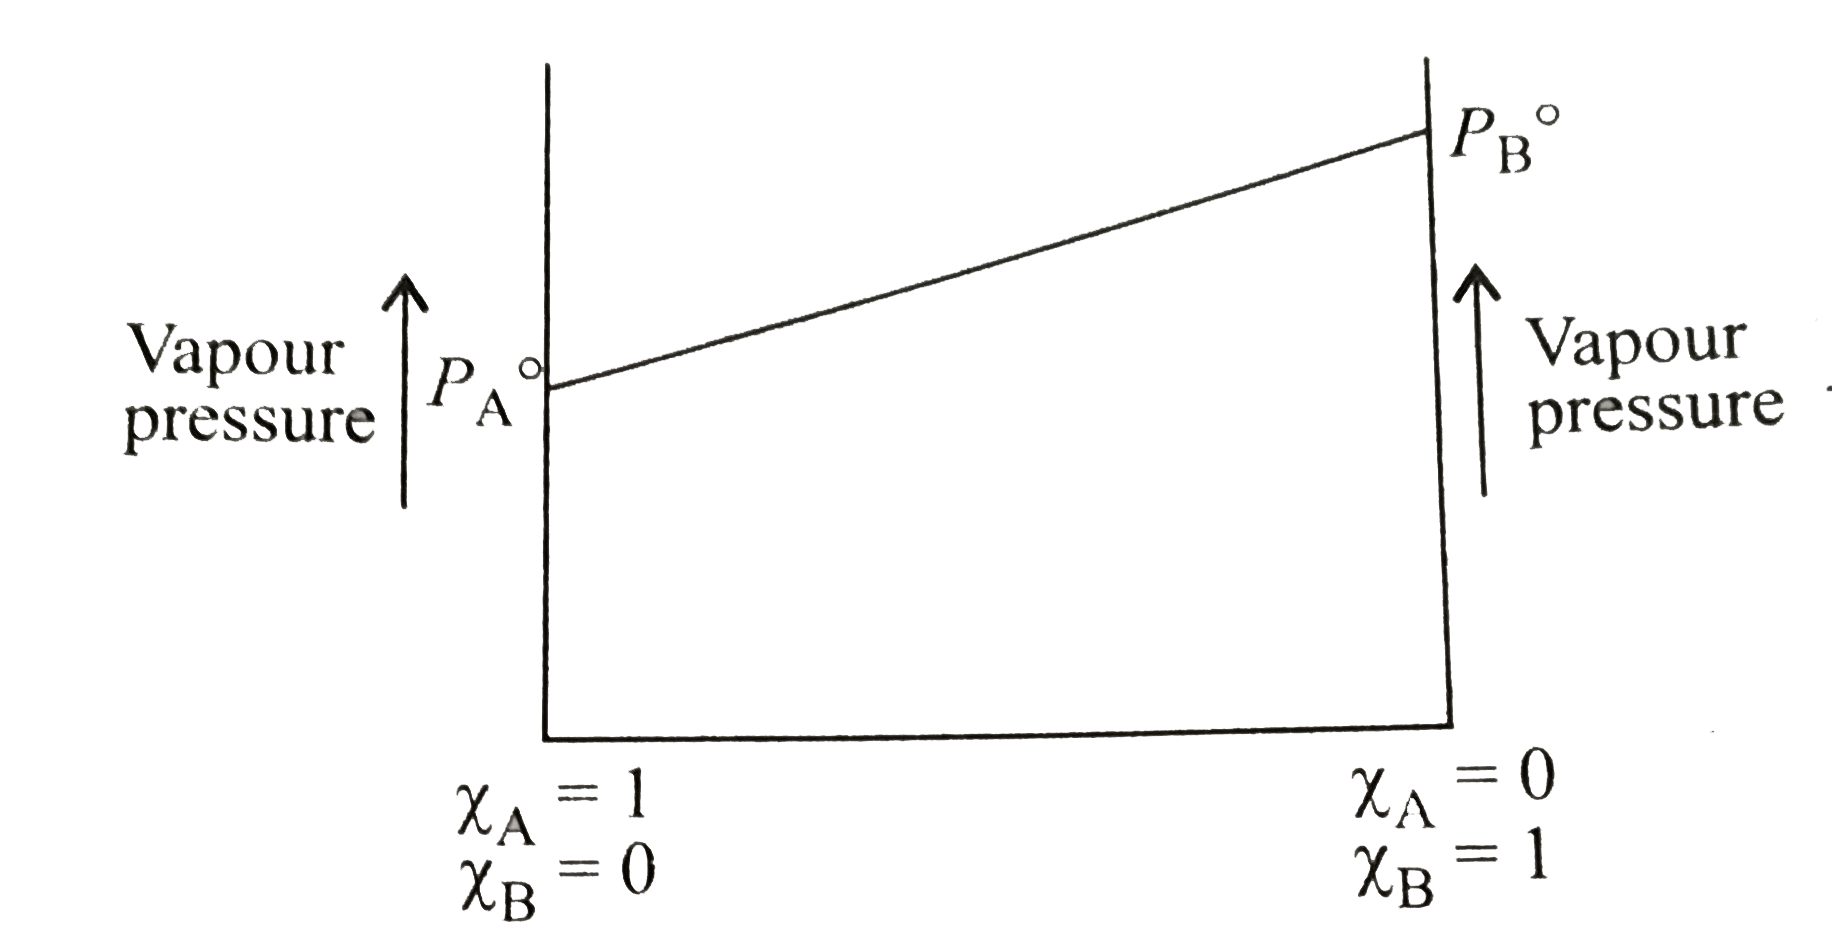
A plot is obtained for two volatile liquids A & B as follows. From the plot answer the following.

What is the total pressure of the solution phase?Solution in Assamese
Step by step video & image solution for A plot is obtained for two volatile liquids A & B as follows. From the plot answer the following. What is the total pressure of the solution phase? by Chemistry experts to help you in doubts & scoring excellent marks in Class 12 exams.
Updated on:21/07/2023Topper's Solved these Questions
Similar Questions
The available space occupied by spheres of equal size in three dimensions in both hcp and ccp arrangement is
View SolutionWhich has a higher enthalpy of adsorption, physisorption or chemisorption?
View SolutionThe following is a graph plotted between the vapour pressure of two volatile liquids against their respective mole fractions. Which of the following statements is/are correct?

View SolutionBased on the given diagram, which of the following statements regarding the solutions of two miscible volatile liquids are correct? 1. Plots AD and BC show that Raoult's law is obeyed for the solution in which B is a solvent and A is the solute and as well as for that in which A is solvent and B is solute. 2. Plots CD shows that Dalton's law of partial pressures is observed by the binary solutions of components A and B . EF + EG=EH ,and AC and BD corresponds to the vapour pressures of the pure solvents A and B , respectively. Select the correct answer using the codes given below:
View SolutionThe plot of total vapour pressure as a function of mole fraction of the component of an ideal solution formed by mixing liquids X and Y is
View SolutionWhich of the following plots does not represent the behaviour of an ideal binary liquid solution?
View SolutionIn a solution of the miscible volatile liquids A and B, the plots of their partical V.P. V_(s) their mole fractions is given by (Assume, V.P. of pure Agt V.P. of pure B)
View SolutionWhich of the following plots represents the behavior of an ideal binary liquid solution ?
View SolutionWhich of the following plots represents the behavior of an ideal binary liquid solution ?
View SolutionVapour pressure diagram of some liquids plotted against temperature are shown below Most volatile liquid
View SolutionDerive an equation for solution which shows relation between total pressure and mole fraction of volatile solute and volatile solvent and explain it by plotting graph.
View SolutionWhich of the following plots represents the behaviour of an ideal binary liquid solution ?
View SolutionWhen partial pressure of solvent in solution of non-volatile solute is plotted against its mole fraction, nature of graph is
View SolutionDefine vapour pressure of a liquid. What happens to the vapour pressure when (a) volatile solute dissolves in the liquid and (b) the dissolved solute is non-volatile.
View SolutionA plot is obtained for two volatile liquids A & B as follows. From the plot answer the following. Which of the liquids have higher boiling point?
View Solution
