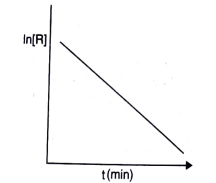
For a chemical reaction variation in concentraction, ln[R] vs. time (min) plot is shown below :
![For a chemical reaction variation in concentraction, ln[R] vs. time (min) plot is shown below : If initial concentration of the reactant is half of the original concentration, how will t(1//2) change?](https://d10lpgp6xz60nq.cloudfront.net/physics_images/RGP_PRA_CHE_QB_XII_C04_E02_007_Q01.png)
If initial concentration of the reactant is half of the original concentration, how will change?Solution in Assamese
Step by step video & image solution for For a chemical reaction variation in concentraction, ln[R] vs. time (min) plot is shown below : If initial concentration of the reactant is half of the original concentration, how will t_(1//2) change? by Chemistry experts to help you in doubts & scoring excellent marks in Class 12 exams.
Updated on:21/07/2023Topper's Solved these Questions
Similar Questions
Mention the hydrolysis products of sucrose.
View SolutionWhat is the composition of tincture of iodine?
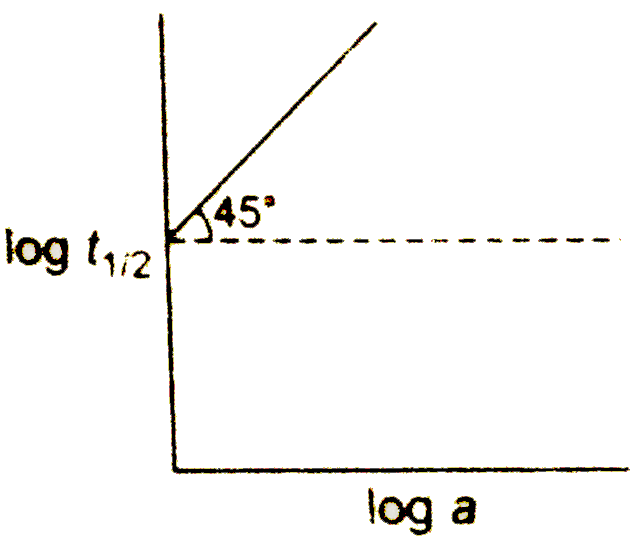
View SolutionWhat will be the order of reaction for a chemical change having logt12 vs log a? ( where a = initial concentration of rectant, t12 =half life)

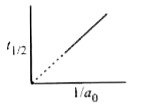
View SolutionThe following graph shows how t_(1//2) (half-life) of a reactant R changes with the initial reactant concentration a_(0) . The order of reaction will be
View SolutionFor a second order reaction, 2" A"to Products, a plot of log t_(1//2) vs log a (where a is the initial concentration) will give an intercept equal to which of the following ?
View SolutionFor a chemical reaction R to P, the variation in the concentration (R) vs time (t) plot is given : Predict the order of reaction.
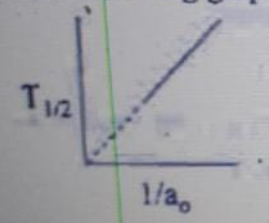
View SolutionThe following graph shows how t1/2 (half-life) of a reactant R changes with the initial reactant concentration a0. The order of the reaction will be

View SolutionWhat will be the order of reaction for a chemical change having logt12 vs log a? ( where a = initial concentration of rectant, t12 =half life)

View SolutionThe following graph shows how T1/2 (half-life) of a reactant R changes with the initial reactant concentration a0.

The order of the reaction will be:
View Solutionএকটি বিক্রিয়ায় বিক্রিয়ক R এর অর্ধায়ু T12 কিভাবে তার প্রারম্ভিক গাঢ়ত্বের ( a0 ) সহিত পরিবর্তিত হয় তা দেখানাে হইল

View SolutionFor a chemical reaction variation in concentraction, ln[R] vs. time (min) plot is shown below : What is the order of the reaction?
View SolutionFor a chemical reaction variation in concentraction, ln[R] vs. time (min) plot is shown below : What is the unit of rate constant K, for the reaction?
View SolutionFor a chemical reaction variation in concentraction, ln[R] vs. time (min) plot is shown below :

Draw the plot of log[R]∘R vs. time(s).
View SolutionWhat will be the order of reaction for a chemical change having log t_((1)/(2)) vs log a? ( where a = initial concentration of rectant, t_((1)/(2)) =half life)
View SolutionFor a certain chemical reaction, Variation in the concentration, In[R] vs time (min) plot is shown below:

For this reaction :What is the order of the reaction ?
View Solution
