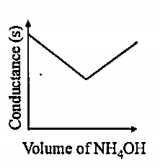
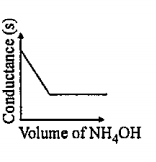
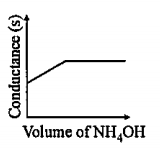
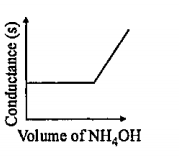
Among the following , the plot that correctly represents the conductometric titration of 0.05 M H2SO4 with 0.1 M NH4OH is
A

B

C

D

Video Solution
|
Answer
Step by step video & image solution for Among the following , the plot that correctly represents the conductometric titration of 0.05 M H_(2)SO_(4) with 0.1 M NH_(4)OH is by Chemistry experts to help you in doubts & scoring excellent marks in Class 12 exams.
Updated on:21/07/2023
Topper's Solved these Questions
Similar Questions
Knowledge Check
- Question 1 - Select One
The [OH−] of 0.005M is H2SO4
A2×10−12MB5×10−3MC10−12MD10−14M - Question 2 - Select One
The pH of a buffer solution of 0.1 M NH4OH[pKa=4.0] and 0.1MNH4Cl is
A1B4C10D13 - Question 3 - Select One
During conductometric titration of 0. 1 MHCl with 1.0 M KOH, which is the correct observation ?
AResistance of the solution decreases upto equivalence point and them increasesBResistance increases upto equivalence point and then decreases.CConductance increases upto equivalence point and then decreases.DConductance decreases upto equivalence point and then becomes almost constant.
Calculate pH values of (i) 0.2 M H2SO4 solution (ii) 0.2M Ca(OH)2 solution.
View SolutionWhat will be the degree of dissociation of 0.005M NH4OHsolution. If pKb for NH4OH is 4.7
View SolutionThe pH of a buffer solution of 0.1 M NH4OH and 0.1 M NH4Cl is (pKb=4.0)
View SolutionArrange following solutions in increasing hydronium ion concentration. The solution are :
(P) 0.1 M HCI (Q) 0.1MH2SO4
(R) 0.001MNH4OH (S) 0.001MCa(OH)2.
The correct order will be:View SolutionThe pH of a 0.05M solution of H2SO4 in water is nearly
View Solution

