 The motion of a car represented by the above data is Solution in Telugu
Uniform motion
Non-uniform motion
Both a & b
None
Step by step video & image solution for The motion of a car represented by the above data is by Biology experts to help you in doubts & scoring excellent marks in Class 7 exams.
Updated on:21/07/2023Topper's Solved these Questions
Similar Questions
How can you say forest is a habitat for people?
View SolutionName two chemicals used to disinfect the water.
View SolutionThe lengths of 62 levels of a plant are measured in millimetres and the data is represented in the following table
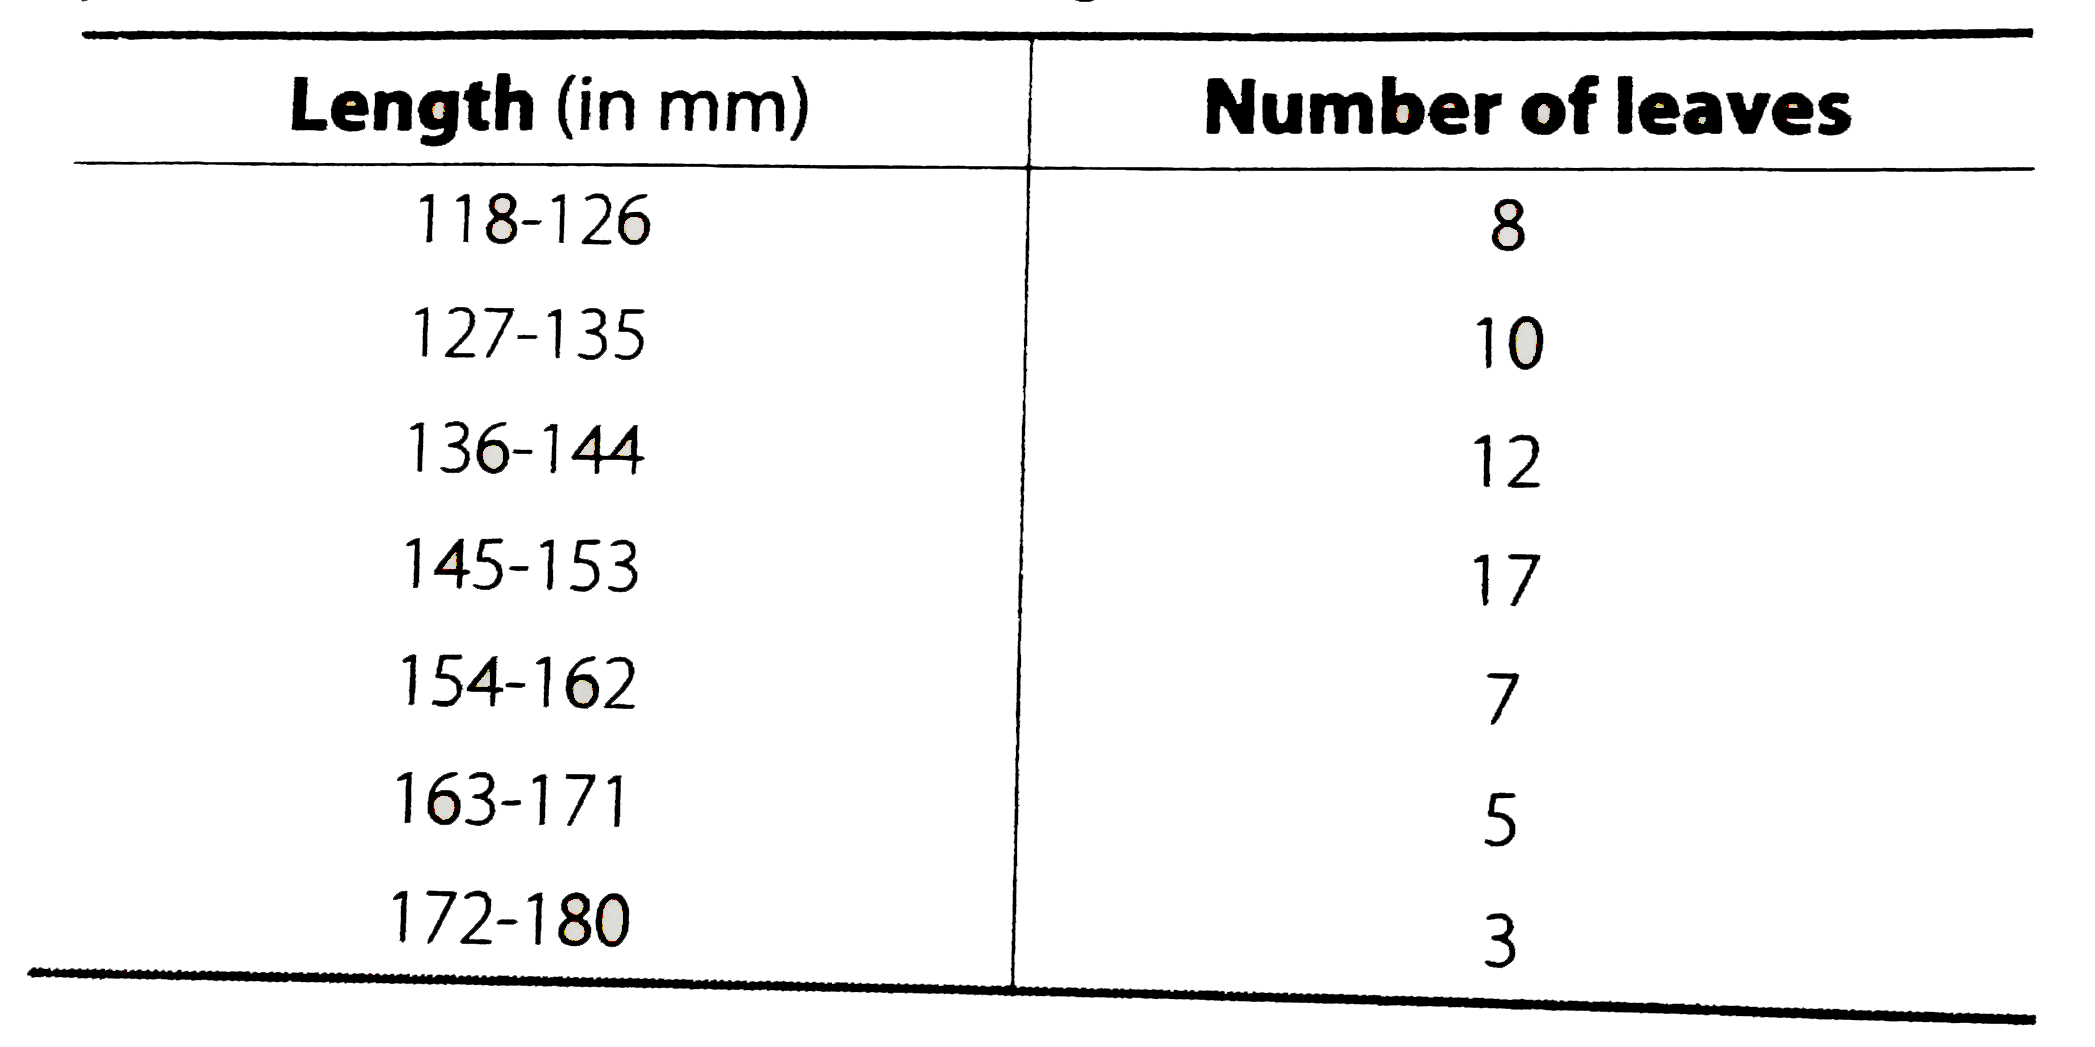
Draw a histrogram to represent the data above.
View SolutionFollowing table shows a frequency distribution for the speed of cars passing through at a particular spot on a high way.

Draw a histogram and frequency polygon representing the data above.
View Solution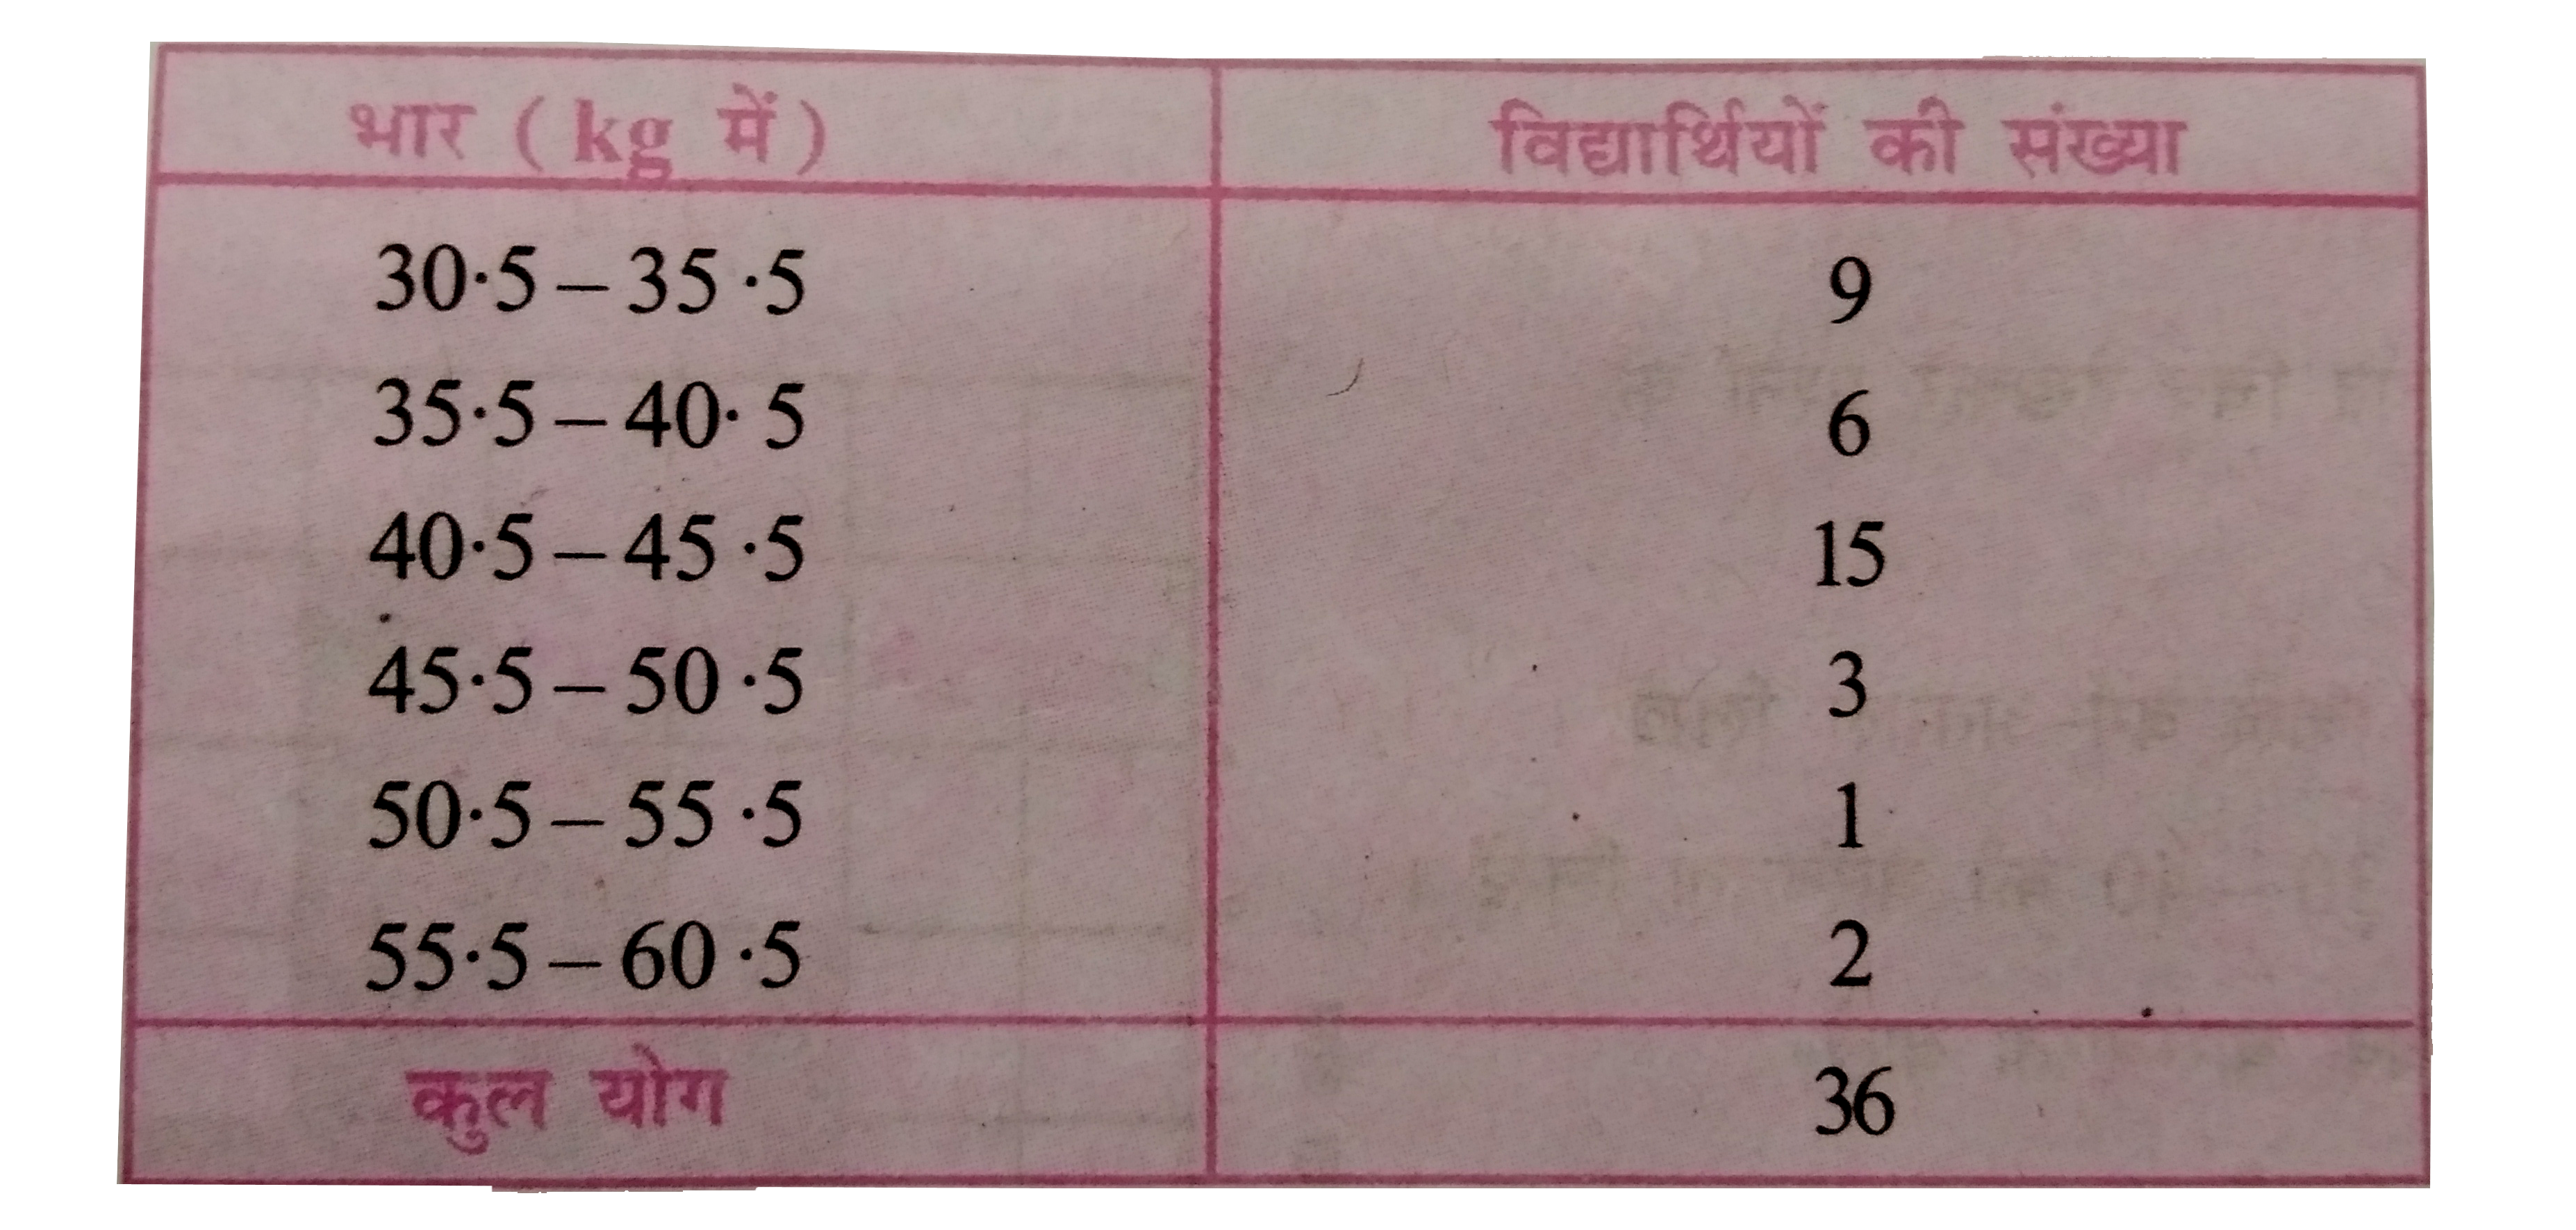
ऊपर दिए गए आँकड़ो को आयतचित्र द्वारा निरूपित करे।
View SolutionThe speed-time graph for a car is shown is Fig.
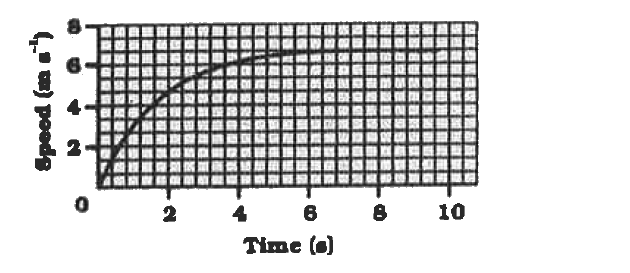
Which part of the graph represents uniform motion of the car?
View SolutionThe speed time graph for a car is shown in the figure.
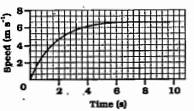
Which part of the graph represents uniform motion of the car?
View SolutionA car in motion is brought to rest by applying brakes. What is the direction of the above identified force with respect to the motion of the car?
View Solution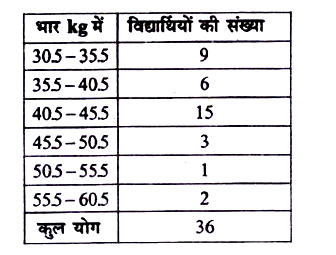
ऊपर दिए गये आकड़ों को आयत चित्र द्वारा निरूपित करें ?
View SolutionThe table shows the production of different types of cars (in thousands).
यह तालिका अलग-अलग प्रकार के कारों का उत्पादन ( हज़ार में) दर्शाती है |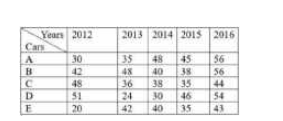 If the data related to the production of cars of type E is represented by a pie chart, then the central angle of the sector
representing the data of production of cars in 2013 will be:
यदि E प्रकार की कारों के उत्पादन से संबंधित आंकड़ों को एक पाई-चार्ट के द्वारा प्रदर्शित किया जाए, तो 2013 में कारों के उत्पादन के आंकड़ों को दर्शाने वाले खंड का केंद्रीय कोण होगा :
View SolutionThe table shows the production of different types of cars
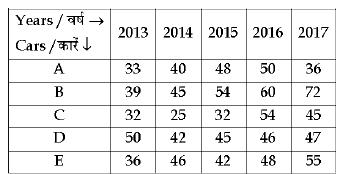
If the data regarding to the production of cars of type B is represented by a pie chart, then the angle of the sector representing the data of production of car in 2016 will be:
View SolutionThe table shows the production of different types of cars (in thousands).
 In the data related to the production of type D cars in represented by a pie chart, then the central angle of the sector representing production of cars in 2015 will be:
यदि D प्रकार की कारों से संबंधित आंकड़ों को एक पाई-चार्ट में प्रस्तुत किया जाए, तो 2015 में कारों के उत्पादन को दर्शाने वाले खंड का केंद्रीय कोण होगा :
View SolutionThe table shows the production of different types of cars (in thousands).
यह तालिका एक कंपनी द्वारा 5 वर्षों में अलग-अलग कारों के उत्पादन (हज़ार में ) को दर्शाती है | If the data related to the production of type D cars is represented by a pie chart, then the central angle of the sector representing the production of
cars in 2013 will be:
यदि D प्रकार की कारों के उत्पादन से संबंधित आंकड़ों को एक पाई-चार्ट में प्रस्तुत किया जाए, तो 2013 में कारों के उत्पादन को दर्शाने वाले खंड का केंद्रीय कोण होगा :
View SolutionThe table shows the production of different types of cars (in thousands).
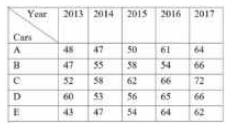
If the data related to the production of type D cars is represented by a pie chart, then the central angle of the sector representing the production of cars in 2016 will be:
View SolutionThe table shows the production of different types of cars (in thousands).
यह तालिका एक कंपनी द्वारा अलग-अलग कारों के उत्पादन (हज़ार में ) को दर्शाती है |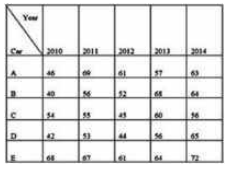 If the data related to the production of type C cars is represented by a pie-chart, then the central angle of the sector representing production of cars in 2012 will be:
यदि C प्रकार की कारों के उत्पादन से संबंधित आंकड़ों को एक पाई-चार्ट में प्रस्तुत किया जाए, तो 2012 में कारों के उत्पादन को दर्शाने वाले खंड का केंद्रीय कोण होगा :
View Solution
