Bar diagrams are applicable to represent. Solution in Bengali
time series data
spatial series data
both a and b
none of these
Step by step video & image solution for Bar diagrams are applicable to represent. by Maths experts to help you in doubts & scoring excellent marks in Class 11 exams.
Updated on:21/07/2023Topper's Solved these Questions
Similar Questions
Z is a complex number. If I Z l = 4 and arg(Z)=5π6,then the value of Z is
View SolutionIf A={1,3,5,7}and P(A)be the power of set A,then find which one of the following is true___
View SolutionApplications Of Ellingham Diagram
View SolutionRepresent the following data, using a percentage bar diagram :

View SolutionWhat are the applications of the Ellingham diagram ?
View SolutionDiscuss the application of the Ellingham diagram:
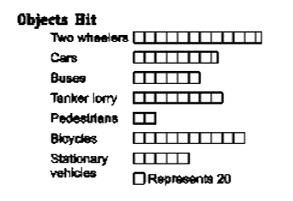
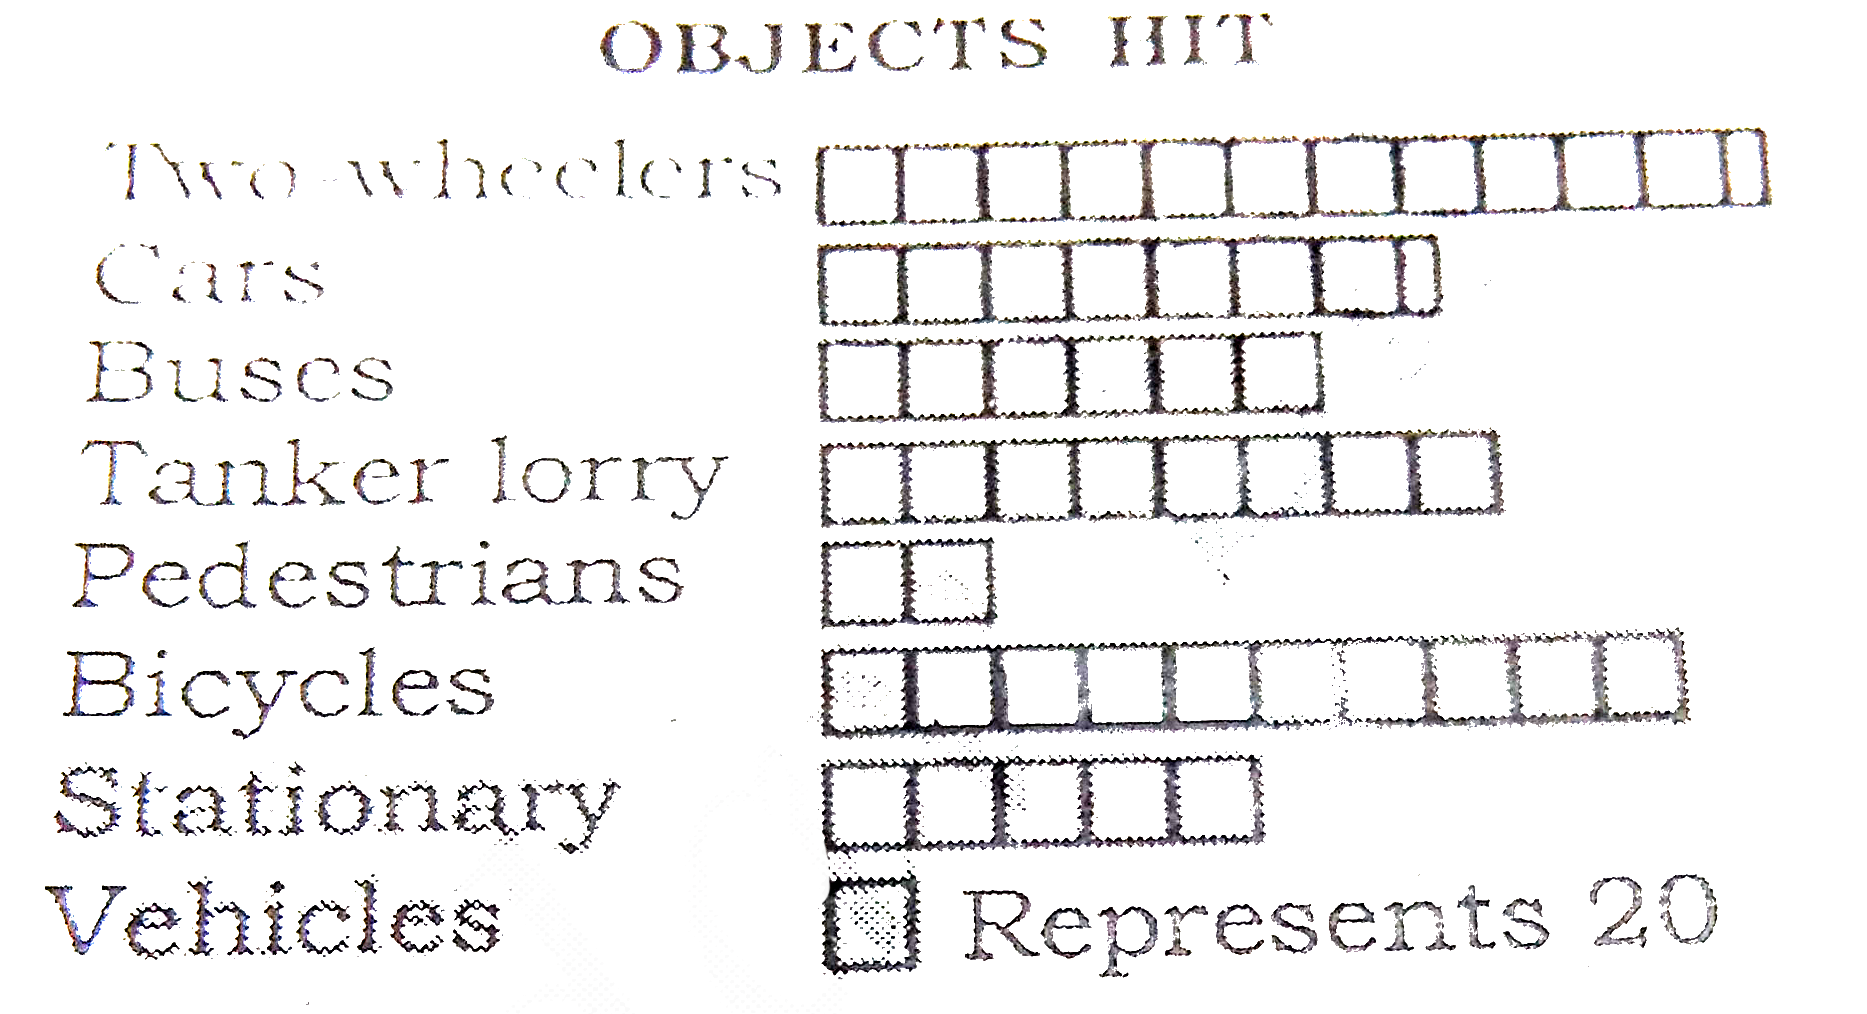
View SolutionDirections (Q. Nos. 16-20) The fallowing is a horizontal bar diagram showing the accidents in which two wheelers are involved with other objects. Study the diagram and answer the questions.

If the data of the bar diagram is represented by a pie chart and the angle of a sector of the pie chart is 36∘ , then this sector represents the accidents involving
View SolutionDifferentiate between multiple bar diagram and compound bar diagram.
View SolutionWhat is Bar magnet. Draw the diagram to represent magnetic length.
View SolutionDraw a bar diagram representing the following data.

View SolutionWrite the applications of Ellingham diagram.
View SolutionIf z = 3 + 5i, then represent z, bar z , -z, - bar z in Argand's Diagram.
View SolutionThe following is a horizontal bar diagram showing the accidents in which two - wheelers are involved with other objects. Study the diagram and answer the question.

कुल दुर्घटनाओं का 60% निम्न वाहनों से होता है ।
View SolutionThe heights of all bars in percentage bar diagram is_______
View SolutionOn which of the following choices is the data best represented by a bar diagram?
View Solution
