Answer the following questions in short: Describe the construction of control chart for mean frm appropriate data when standards are not given.Solution in Bengali
Step by step video & image solution for Answer the following questions in short: Describe the construction of control chart for mean frm appropriate data when standards are not given. by Maths experts to help you in doubts & scoring excellent marks in Class 12 exams.
Updated on:21/07/2023Topper's Solved these Questions
Similar Questions
Find out the correct answer out of the options given against each questions : In random sampling with replacement from a population with standard deviation σ if the sample size is equal to the population size, N, then the standard error of sample mean will be
View SolutionFind out the correct answer out of the options given against each question : Total no. of all possible samples of size 3 from a population of size 20 in case of simple random sample without replacement is-
View SolutionAnswer the following questions using the data given
View SolutionCalculate mean and standard deviation of the following data by short-cut method:
View Solutionनिम्न आँकड़ो से , लघु विधि द्वारा माध्य तथा मानक विचलन ज्ञात कीजिए ।
8,11,14,17,29,23,26
View SolutionConstruct mean deviation (from median) for the following data:

View SolutionDescribe the construction of standard hydrogen electrode.
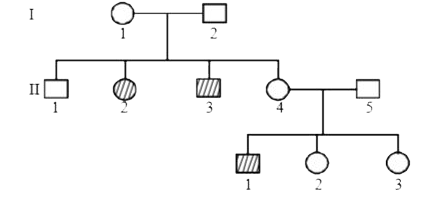
View SolutionStudy the given pedigree chart and answer the given questions :-

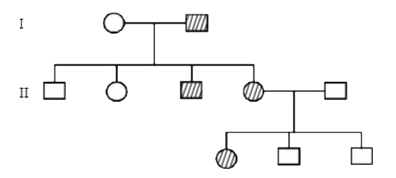
View SolutionStudy the given pedigree chart and answer the given questions :-

View SolutionAnswer the following questions in short: Give the procedure of Construction of control charts for number of defectives, in both cases when standards are given and not given.
View SolutionAnswer the following questions : Give two examples of Control chart for attributes.
View SolutionAnswer the following questions in short: When mean and mode of binomial distribution are same?
View SolutionAnswer the following questions in short: Discuss the concept of 3−σimits in the construction of control charts.
View SolutionAnswer the following questions: Mention the control limits of np-chart in context of S.Q.C.
View SolutionAnswer the following questions: Why 3σ limit is important for construction of control chart?
View Solution
