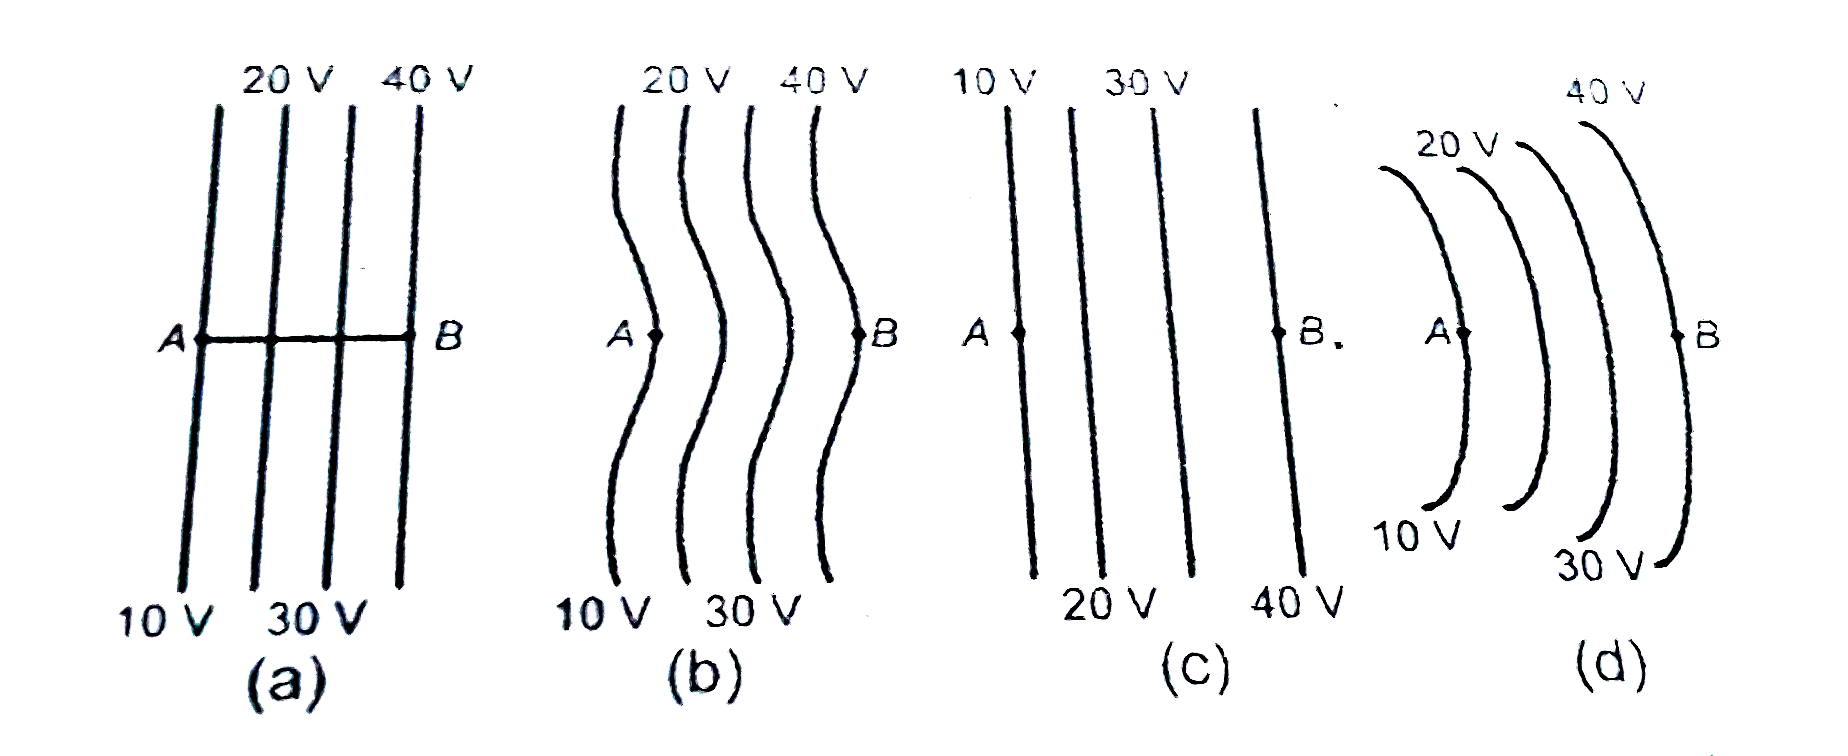
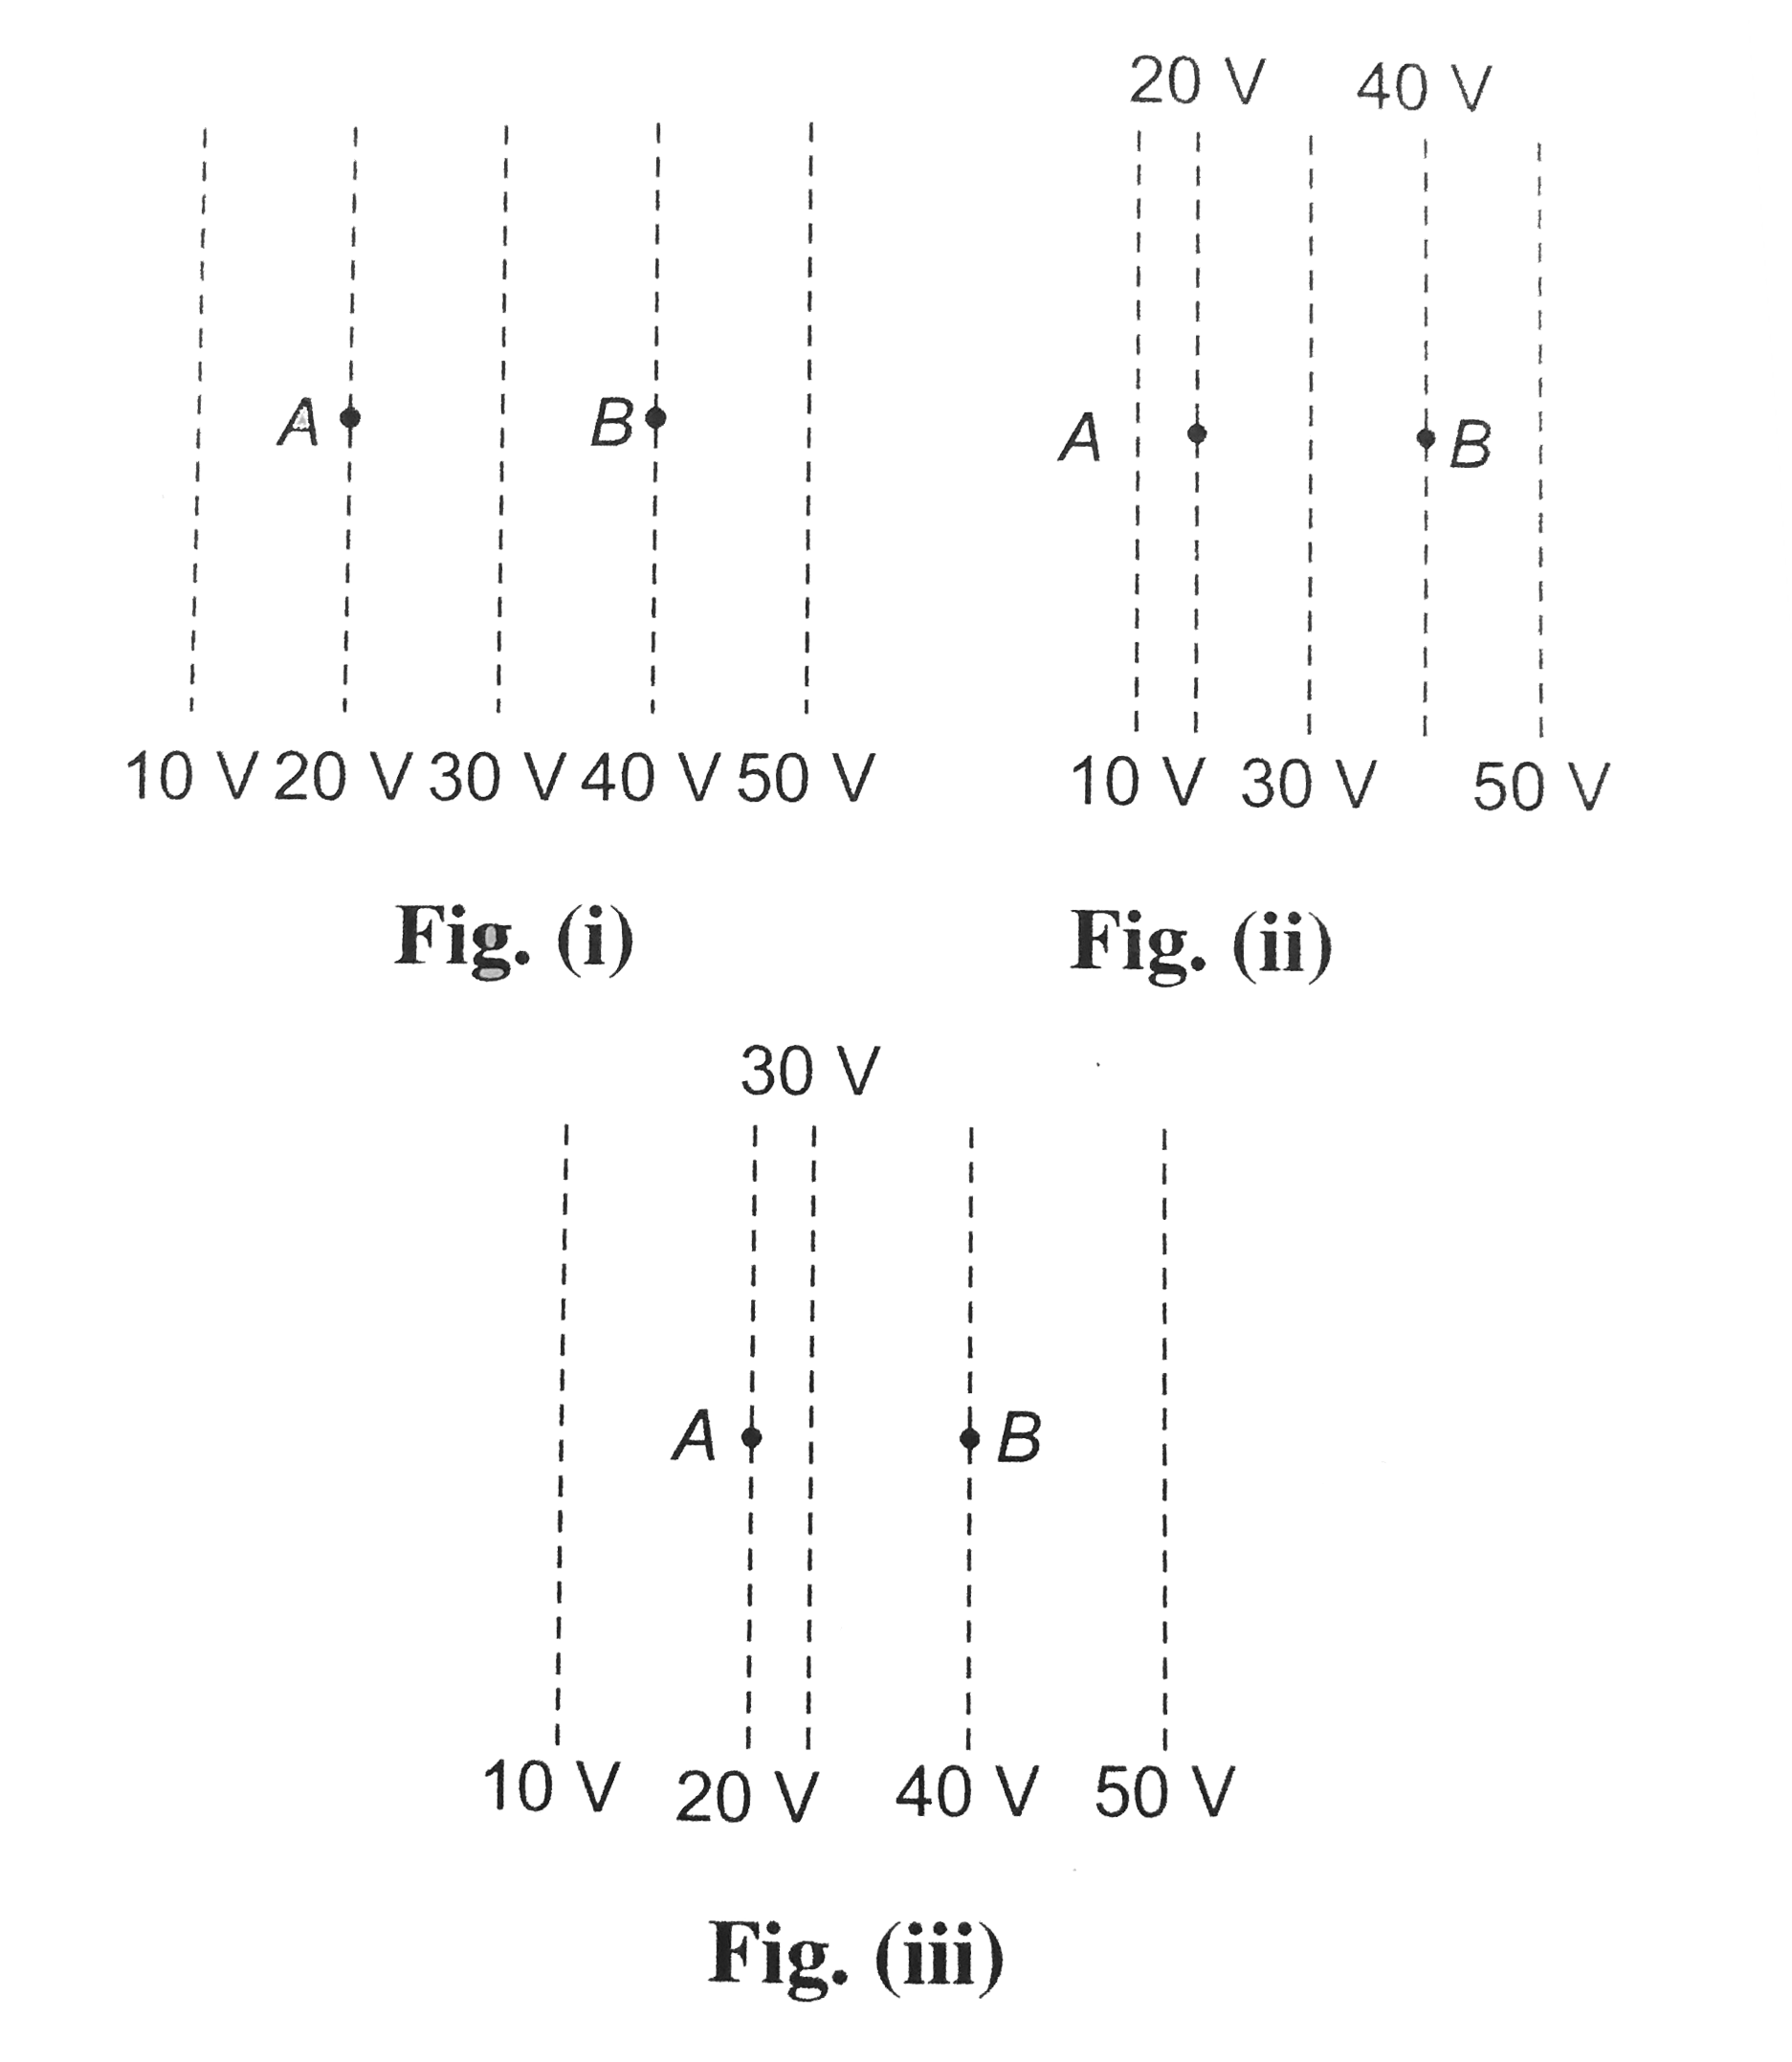
The diagram below show regions of equipotential:
A positive charge is moved from A to B in each diagram.
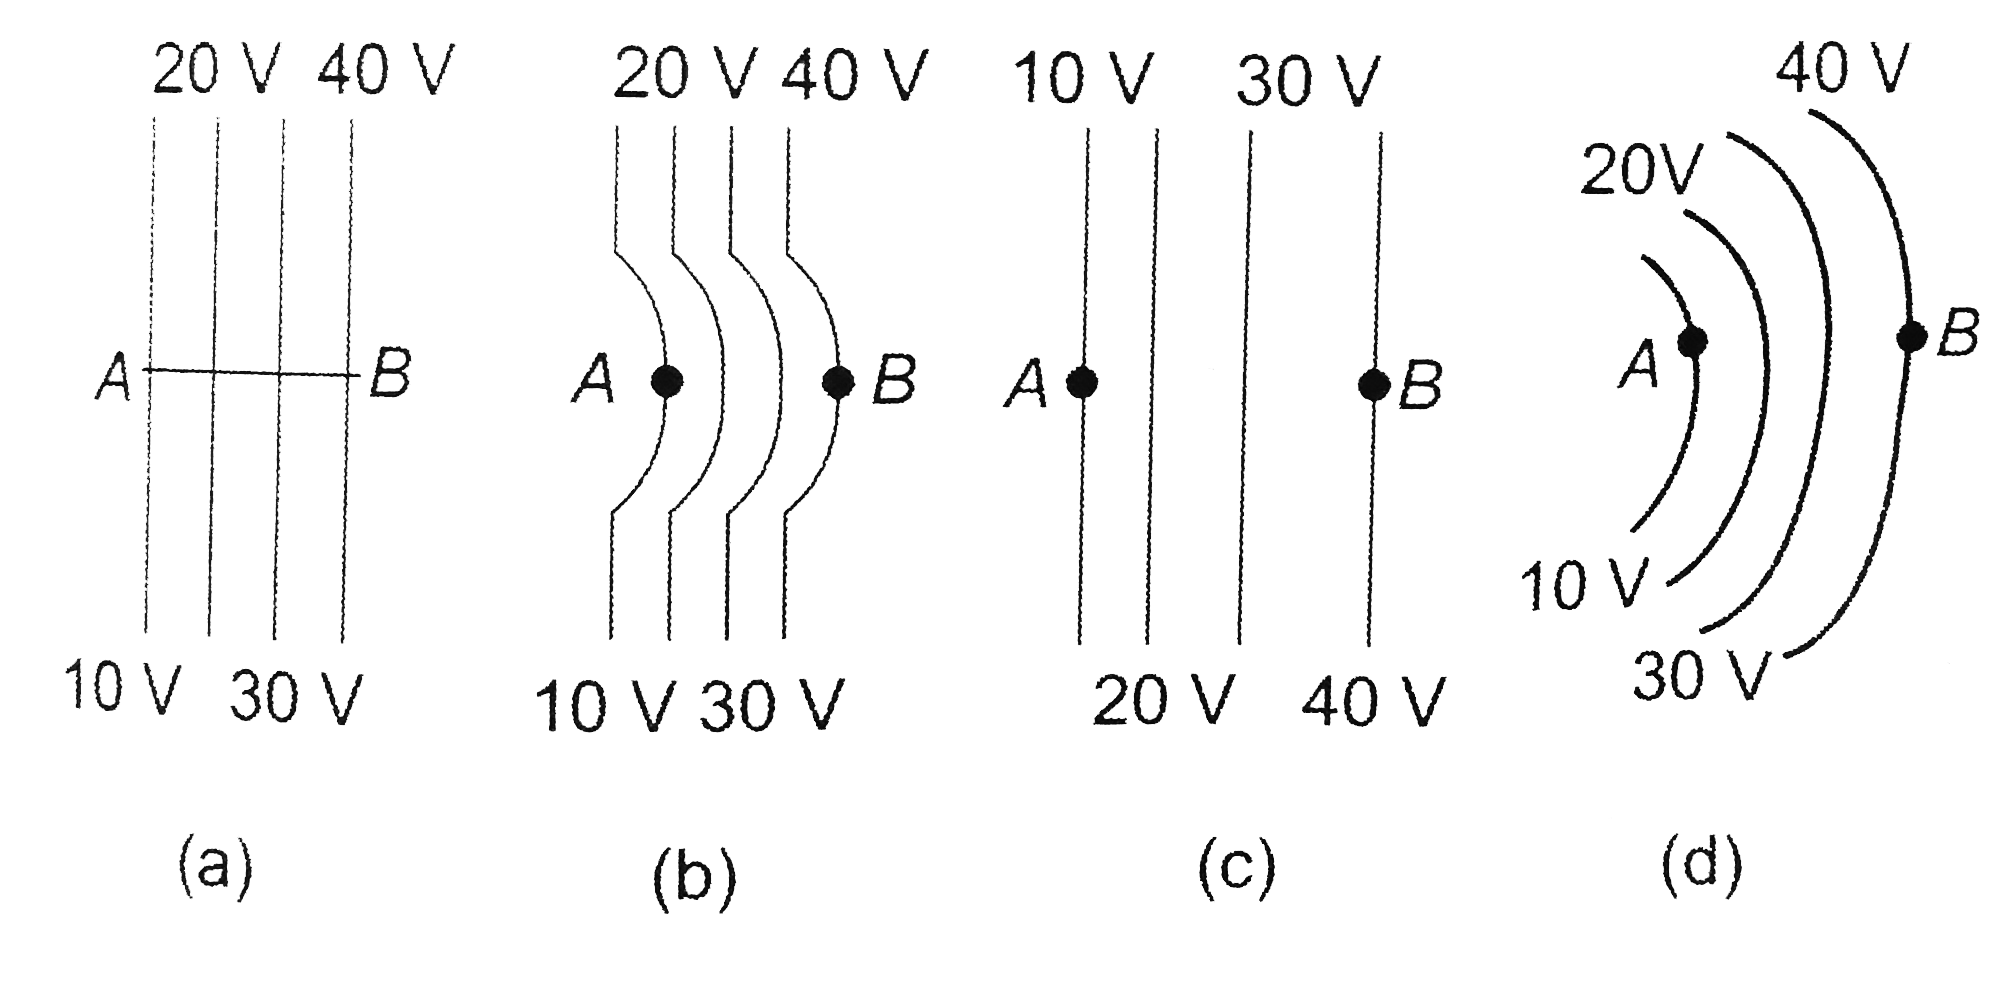
Maximum work is required to move q in figure (ii)
In all the four cases, the work done is the same
Minimum work is required to move q in figure (i)
Maximum work is required to move q in figure (ii)
The correct Answer is:B
Step by step video & image solution for The diagram below show regions of equipotential: A positive charge is moved from A to B in each diagram. by Physics experts to help you in doubts & scoring excellent marks in Class 12 exams.
Updated on:21/07/2023Similar Questions
Knowledge Check
In the diagram shown below:
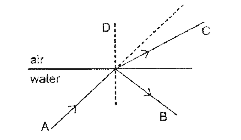 AB is incident ray and C is refracted ray.BA is incident ray and B is refracted ray.CC is incident ray and Bis refracted ray.DA is incident ray and C is refracted ray.
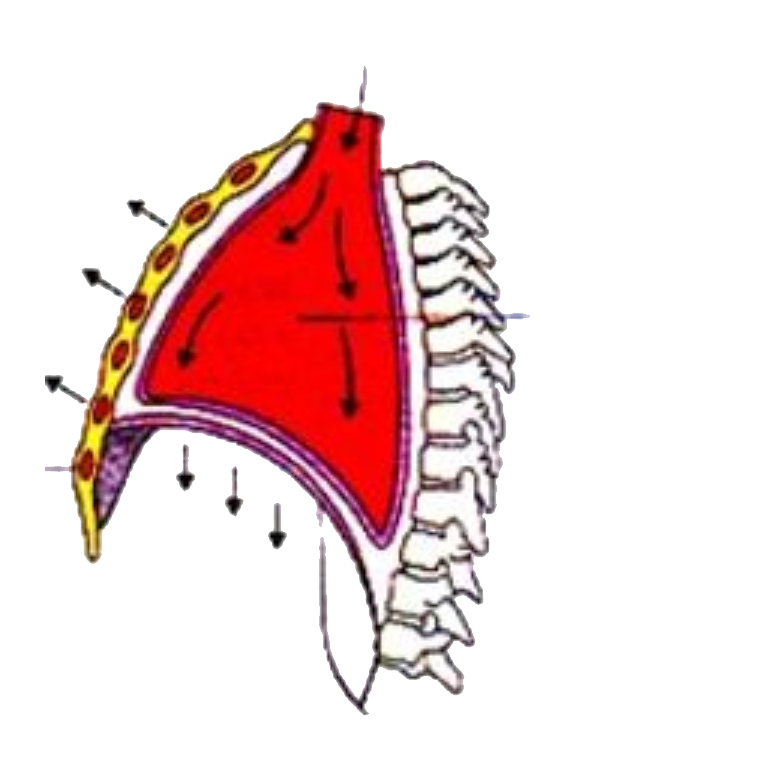
The diagram given below represents
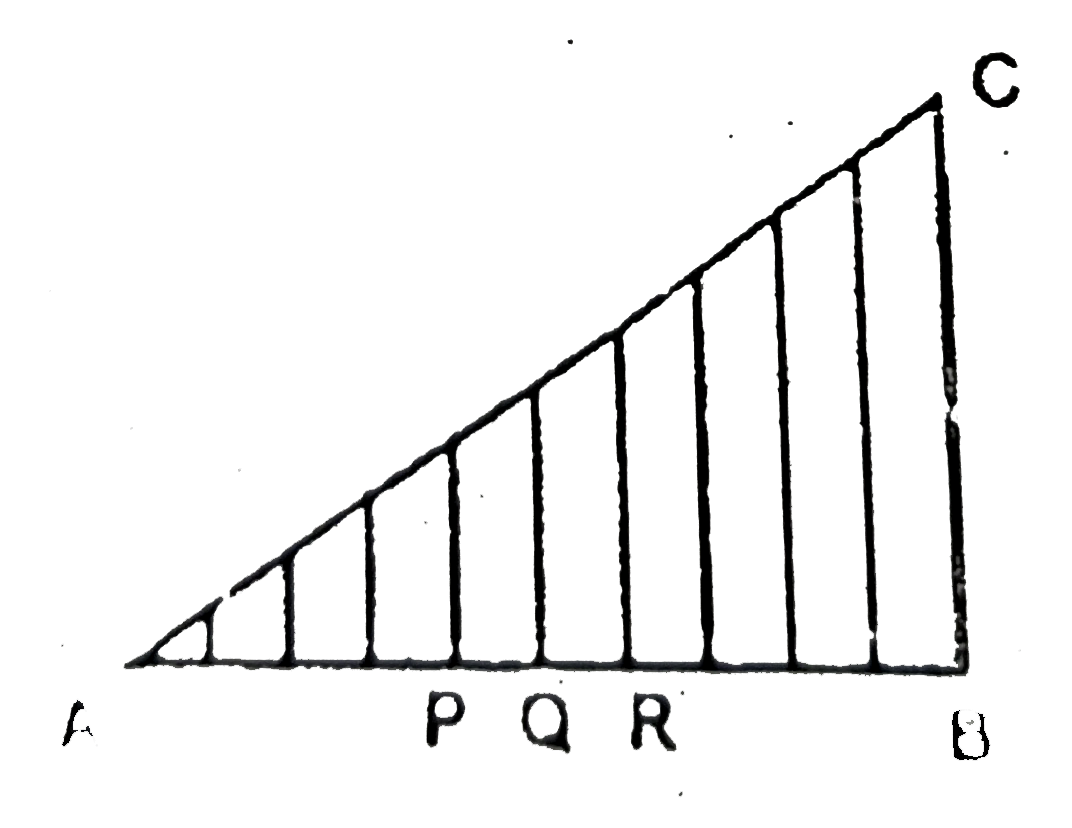
View SolutionThere are infinite equipotential lines all parallel to BC in a right angled triangular region ABC as shown in the figure. All the points on a line have the same potential proportional to the length of the line.
A positive charge is moved from A to B and C separately to do work. WA→B & WA→C, respectively, then

View SolutionFigure shows some equipotential lines distributed in space. A charged object is moved from point A to point B.
View SolutionFigure shows some equipotential lines distributed in space. A charged object is moved from point A to point 5.

View SolutionFigure shows some equipotential lines distributed in space. A charged object is moved from point A to point 5.

View Solution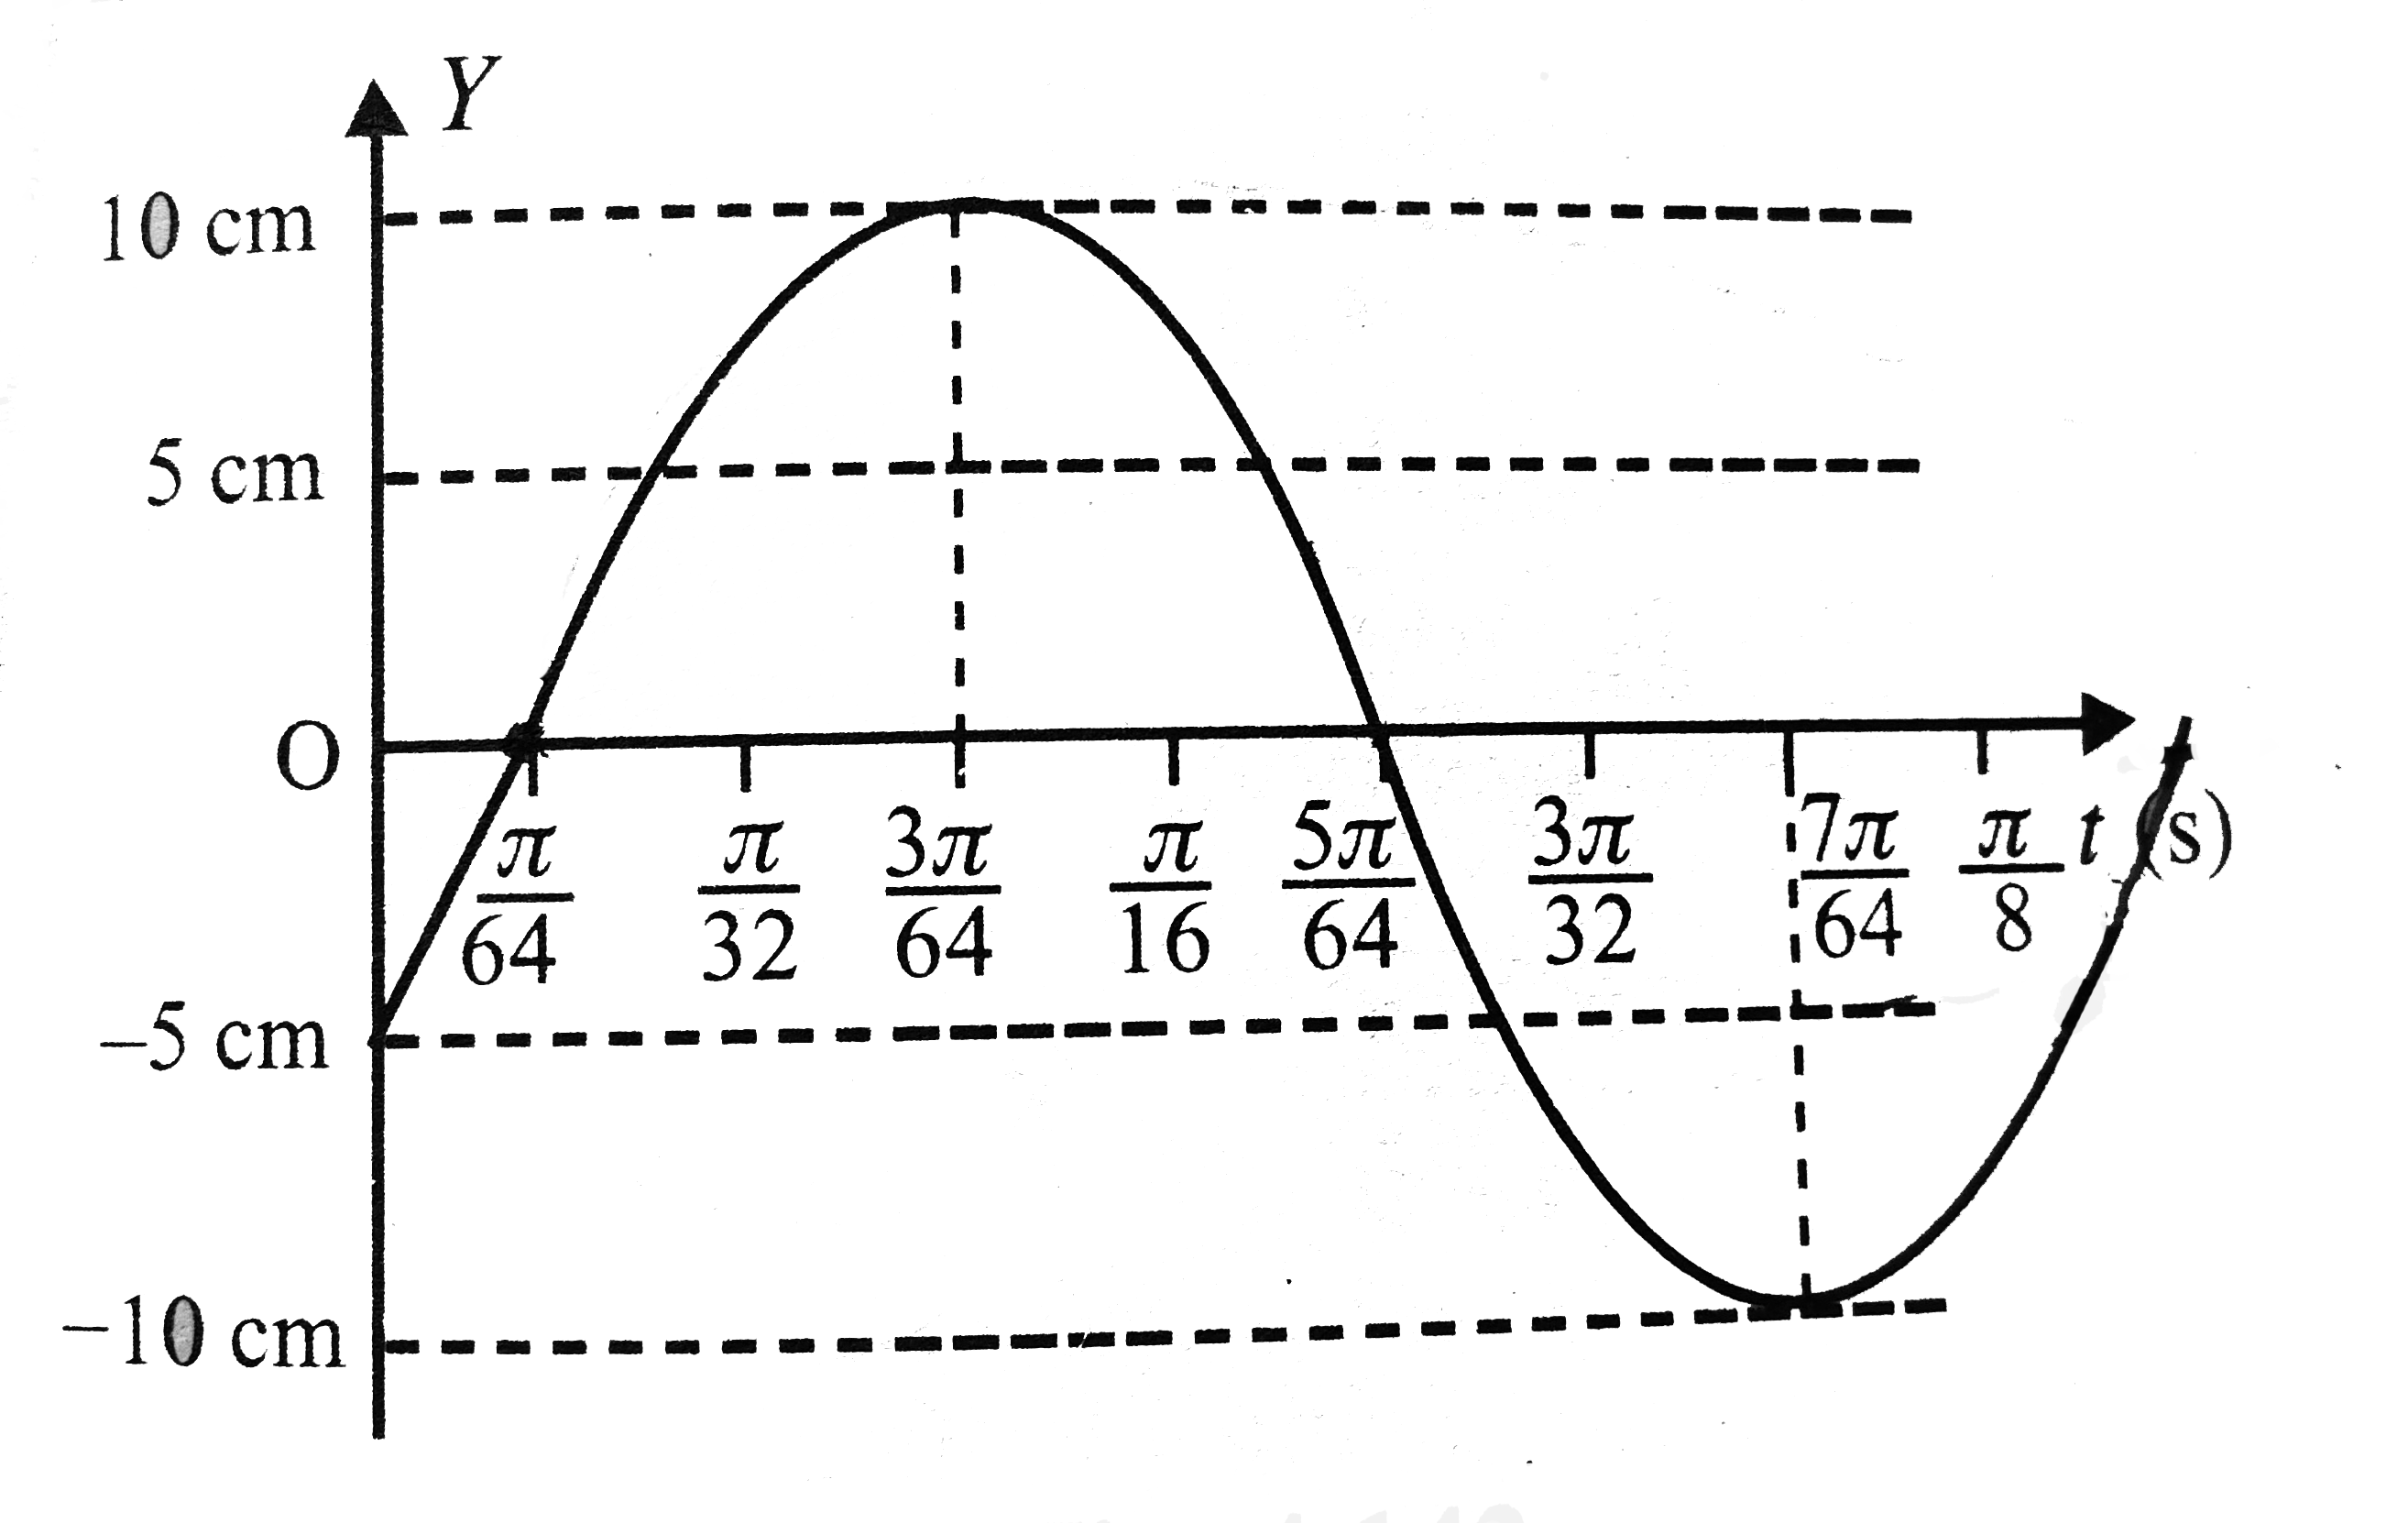
The diagram below shows a sinusoidal curve. The equation of the curve will be
View Solution

