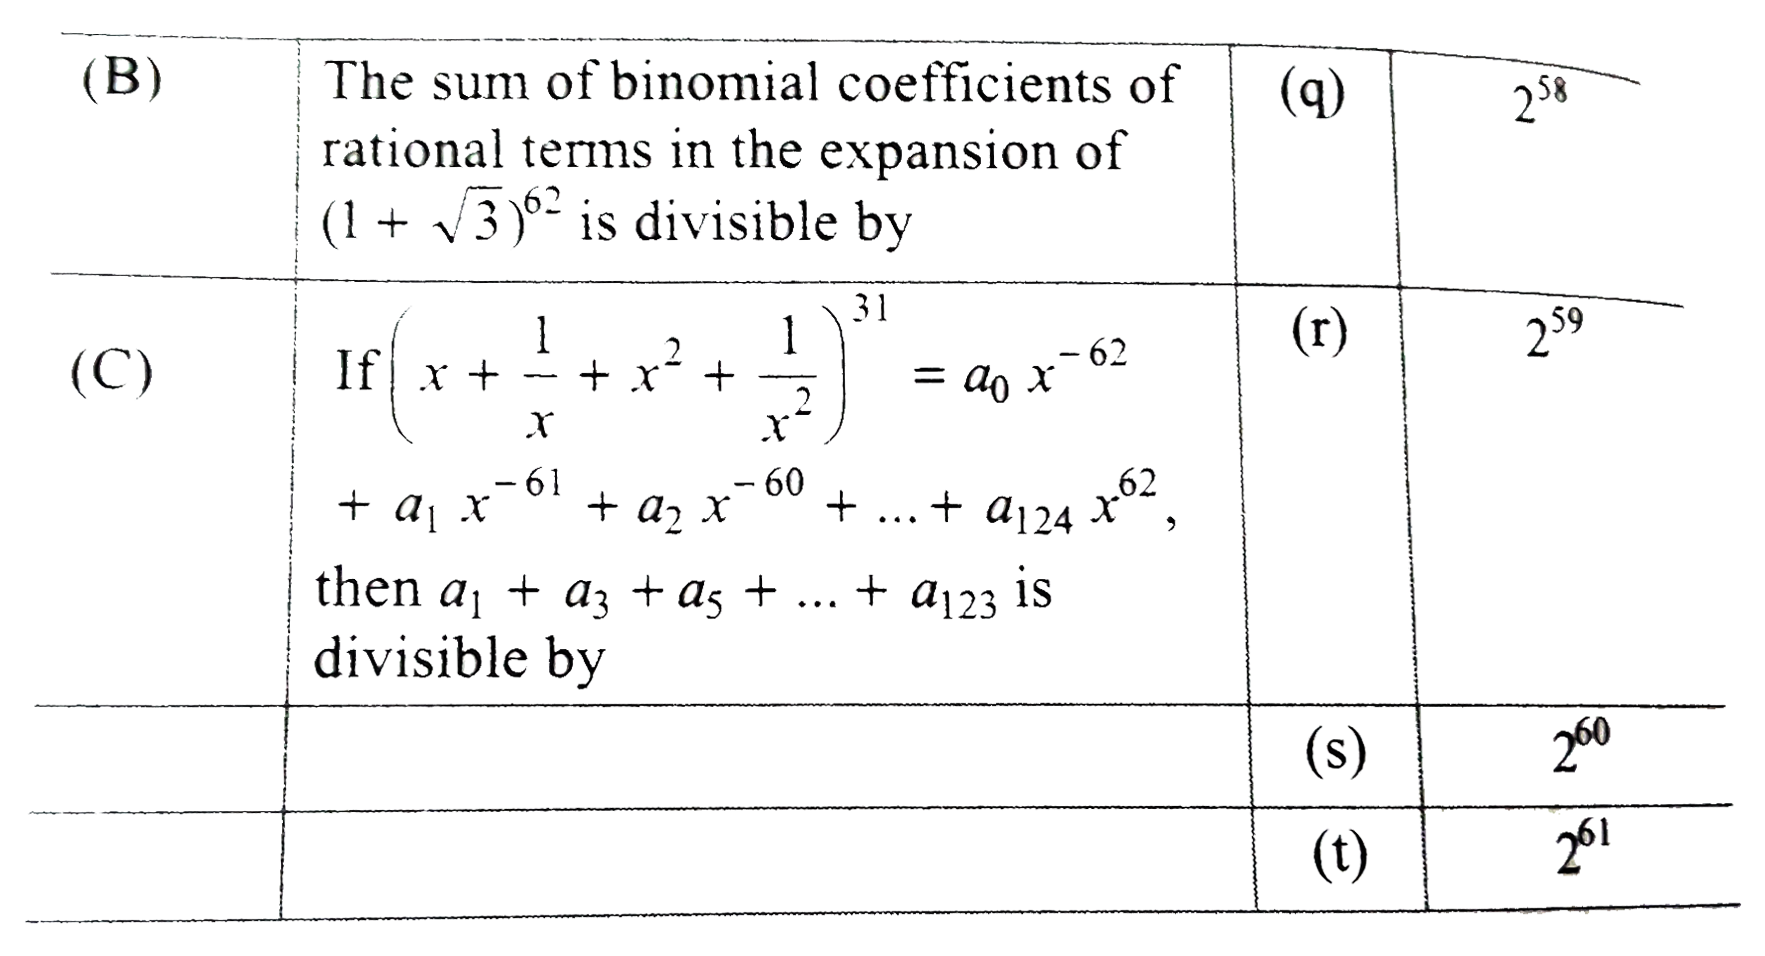
The correct Answer is:(A)→(p,q,r,s);(B)→(p,q,r,s,t);(C)→(p,q,r,s,t)
Step by step video & image solution for by Maths experts to help you in doubts & scoring excellent marks in Class 12 exams.
Updated on:21/07/2023Topper's Solved these Questions
- BIONOMIAL THEOREMBOOK - ARIHANT MATHS ENGLISHCHAPTER - BIONOMIAL THEOREMEXERCISE - Exercise (Statement I And Ii Type Questions)
7 Videos
- BIONOMIAL THEOREMBOOK - ARIHANT MATHS ENGLISHCHAPTER - BIONOMIAL THEOREMEXERCISE - Exercise (Subjective Type Questions)
21 Videos
- BIONOMIAL THEOREMBOOK - ARIHANT MATHS ENGLISHCHAPTER - BIONOMIAL THEOREMEXERCISE - Exercise (Single Integer Answer Type Questions)
7 Videos
- AREA OF BOUNDED REGIONSBOOK - ARIHANT MATHS ENGLISHCHAPTER - AREA OF BOUNDED REGIONSEXERCISE - Exercise (Questions Asked In Previous 13 Years Exam)
23 Videos
- CIRCLE BOOK - ARIHANT MATHS ENGLISHCHAPTER - CIRCLE EXERCISE - Exercise (Questions Asked In Previous 13 Years Exam)
16 Videos
Similar Questions
Statement-1 Greatest coefficient in the expansion of
(1+3x)6 is 6C3⋅33 .
Statement-2 Greatest coefficient in the expansion of
(1+x)2n is the middle term .
View SolutionIf the third term in the expansion of (1x+x(log)10x)5 is 1000, then find x.
View SolutionIf (1+x+x2+x3)n=3n∑r=0brxrand3n∑r=0br=k,t h e n3n∑r=0rbr is
View SolutionArea of the region
{(x,y)∈R2:y≥√|x+3|,5y≤x+9≤15} is equal to
View Solutionabout to only mathematics
View SolutionHow many lines of symmetry does the above figure have ?
View SolutionWhich of the following are correct chain isomers of butane ? (i)
View SolutionDetermine the point of symmetry of a regular hexagon.
View SolutionDtermine the images of the following figure about the given line :
View SolutionMatch the following Column A to Column B

View SolutionMatch the following Column A to Column B

View SolutionMatch the following Column A to Column B

View SolutionFind the area of the figure given below.

View SolutionThe area of the shaded part in the figure given below is ______.

View SolutionThe inequation represented by the graph given below is :
View SolutionThe inequation that best describes the graph given below is _________
View Solution


