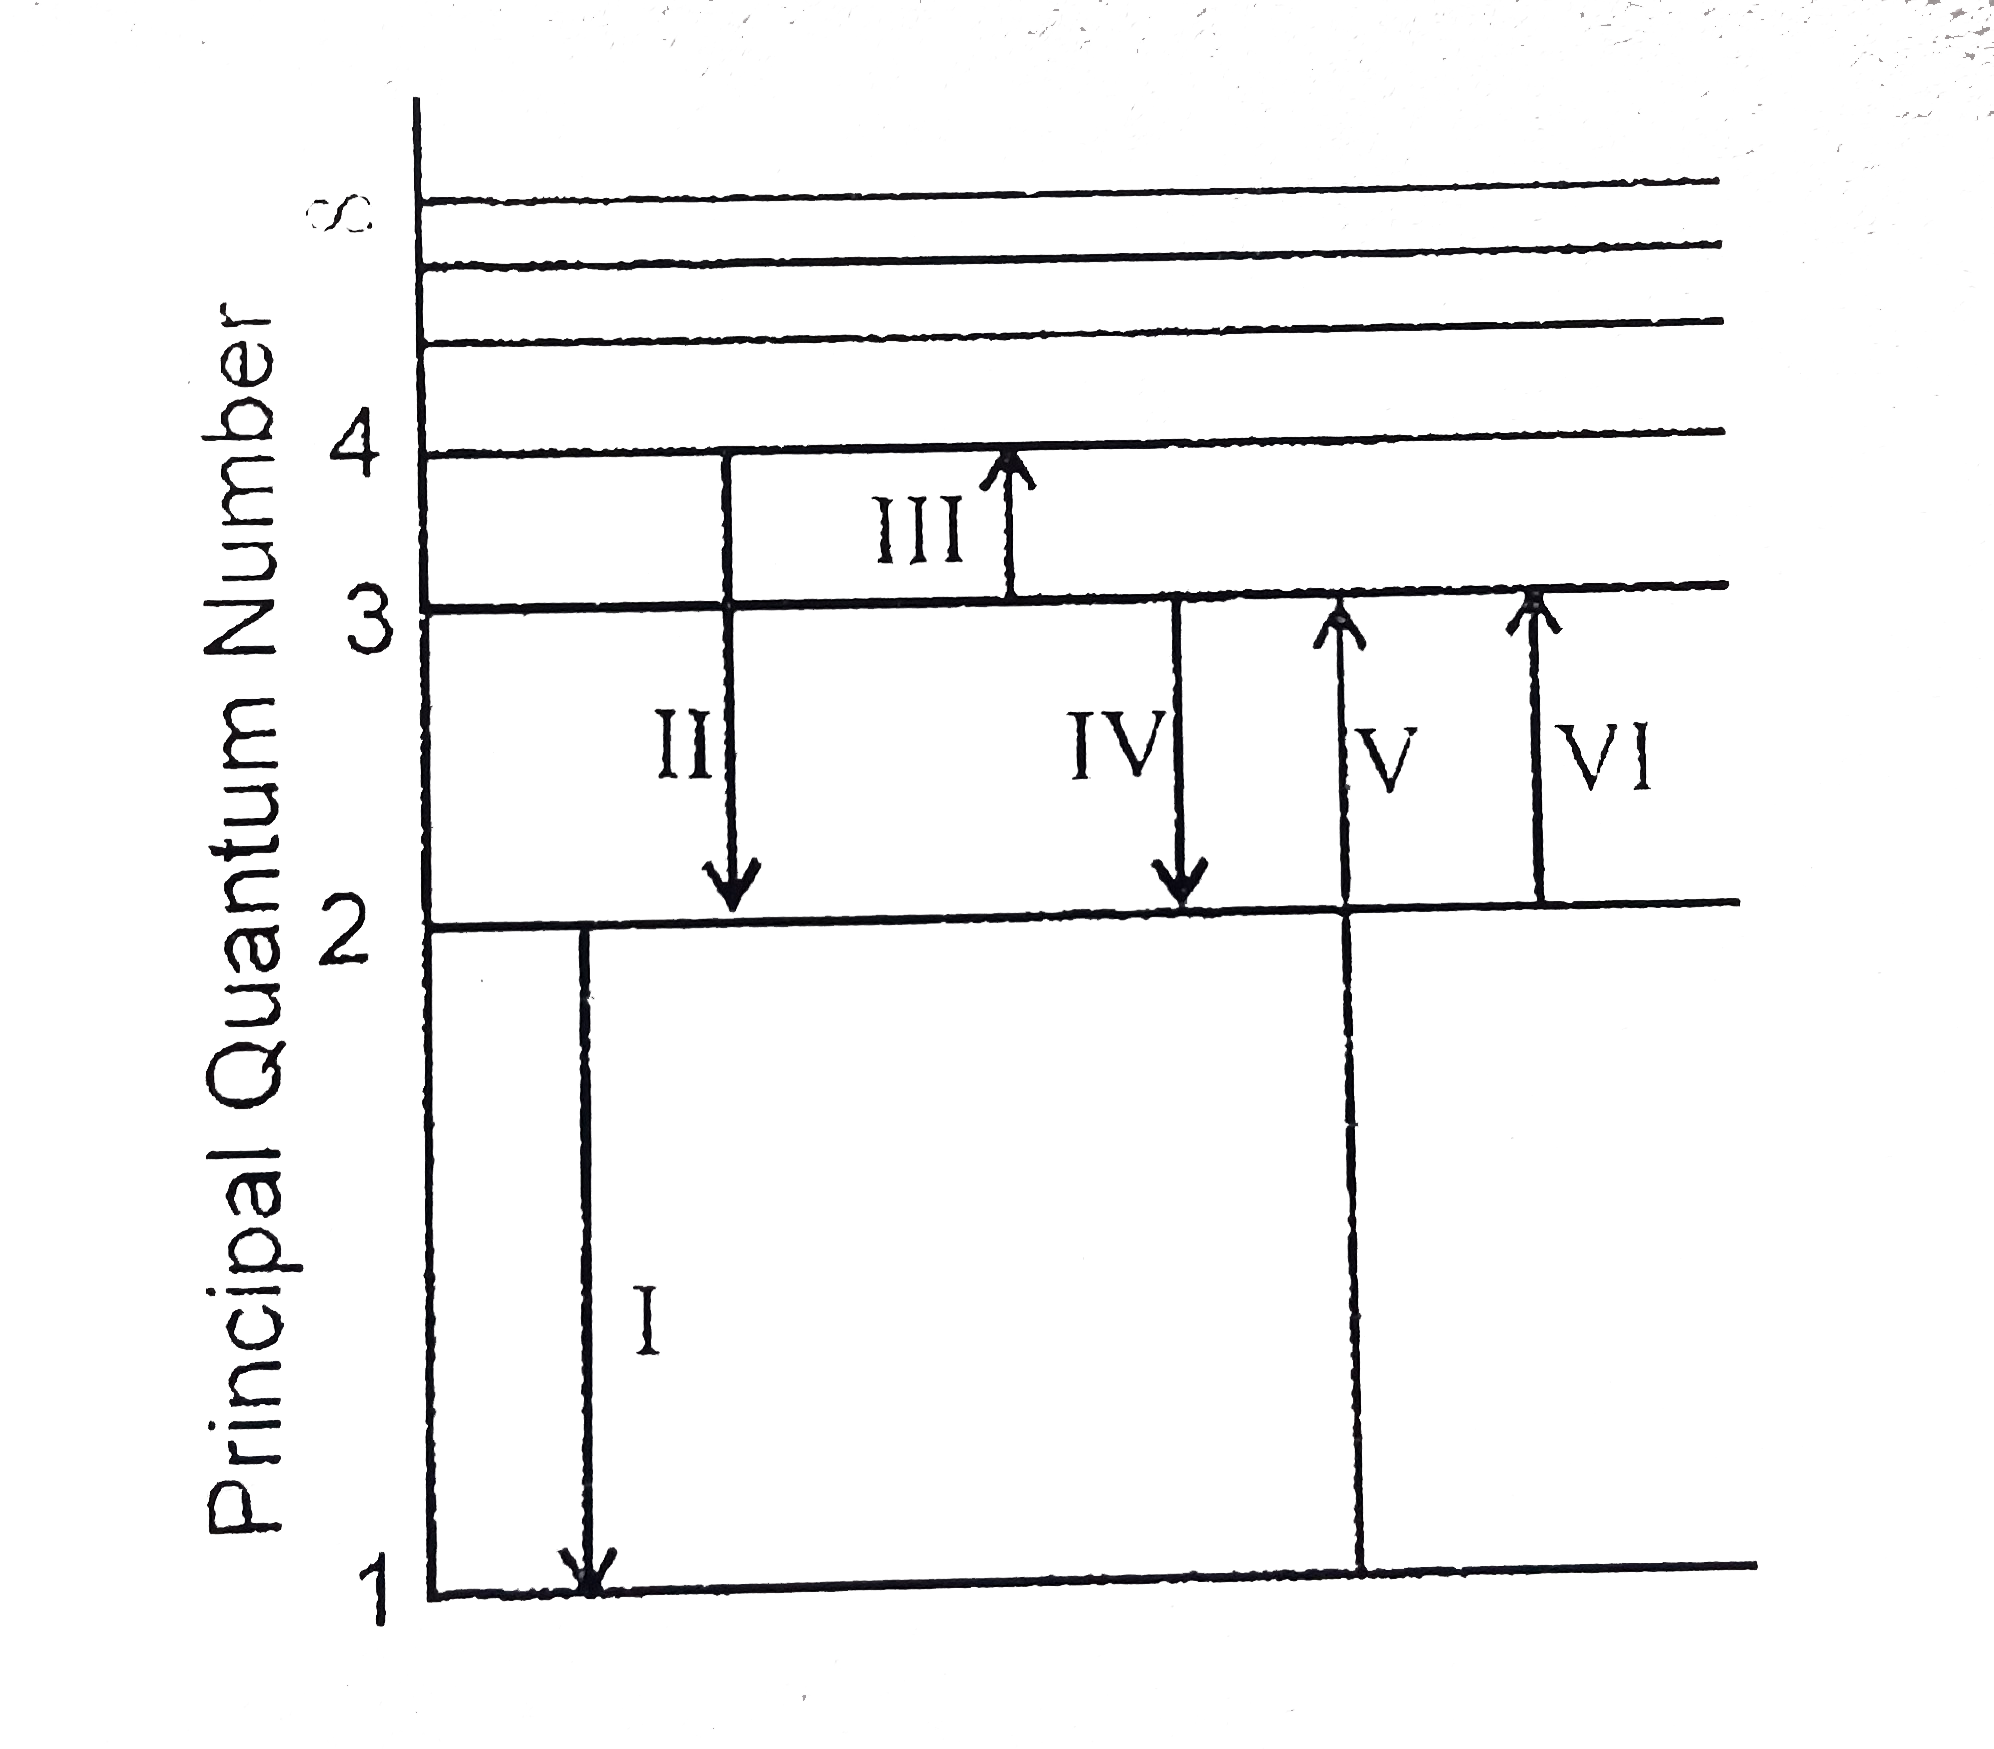
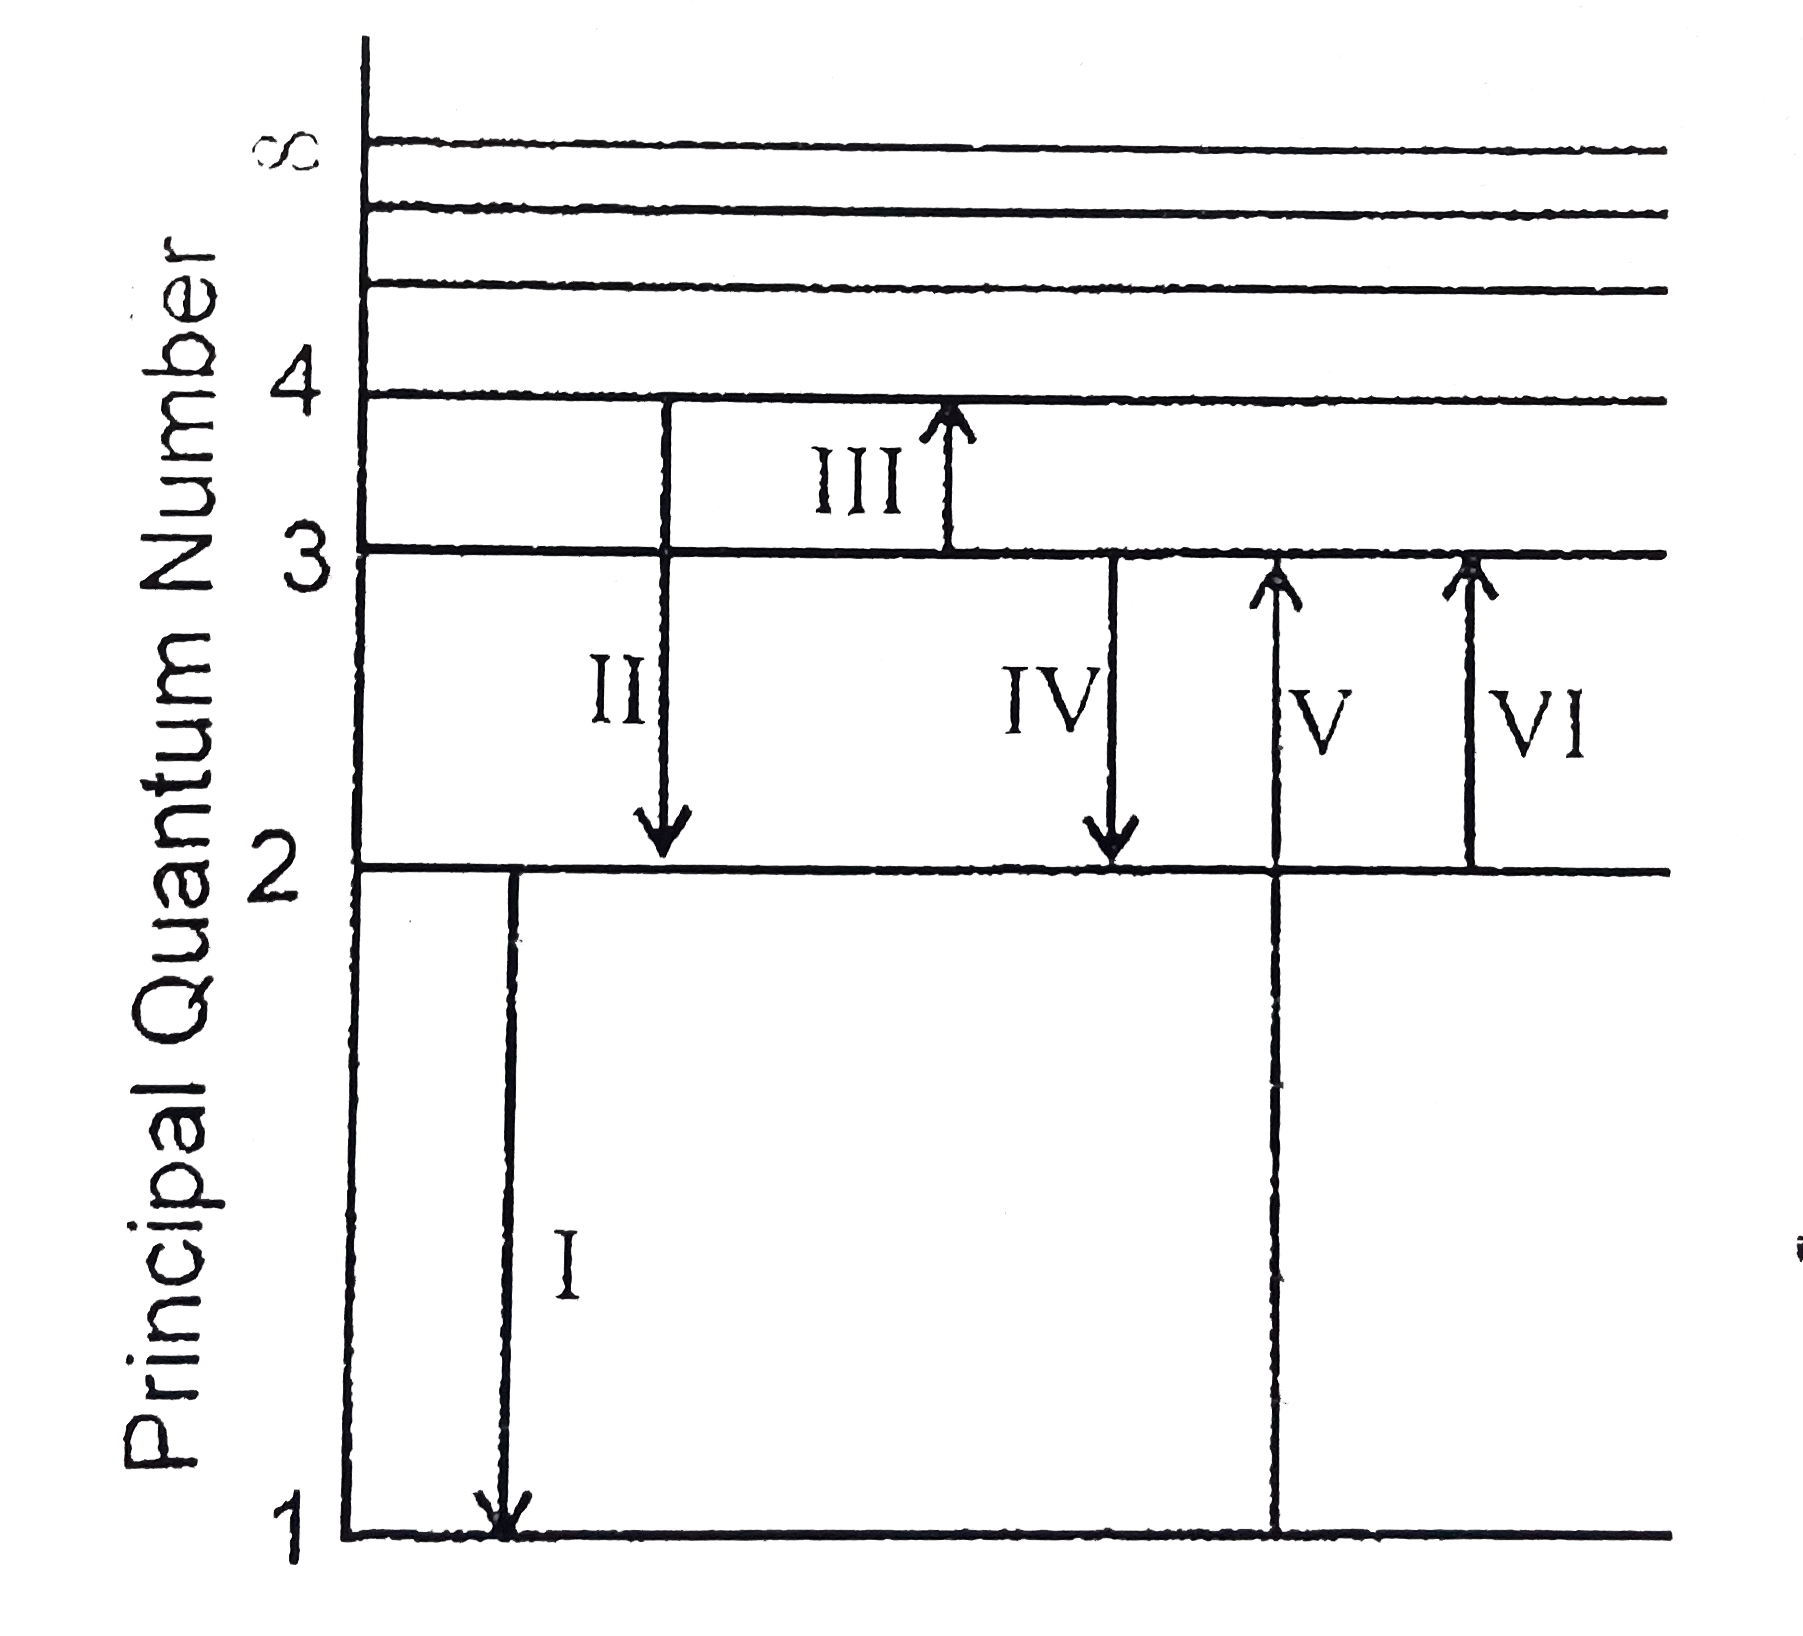
Draw energy level diagram for Balmer series for transition between eriergy levels.
To draw the energy level diagram for the Balmer series, we will follow these steps:
Step 1: Identify the Energy Levels
The energy levels in a hydrogen atom are represented by the principal quantum number n. For the Balmer series, we focus on transitions where the electron falls to the n=2 level from higher energy levels (n=3,4,5,…).
Step 2: Draw the Energy Levels
1. Draw horizontal lines to represent the energy levels. Label them as follows:
- n=1 (ground state)
- n=2 (first excited state, where transitions for the Balmer series occur)
- n=3 (second excited state)
- n=4 (third excited state)
- n=5 (fourth excited state)
- Continue this pattern for higher levels if needed.
Step 3: Indicate the Transitions
Draw arrows to indicate the transitions from higher energy levels down to n=2:
- From n=3 to n=2
- From n=4 to n=2
- From n=5 to n=2
Each arrow represents a photon being emitted when the electron transitions from a higher energy level to n=2.
Step 4: Label the Wavelengths
Label each transition with the corresponding wavelength (or frequency) of the emitted light. The wavelengths can be calculated using the Rydberg formula:
1λ=RH(122−1n2)
Where RH is the Rydberg constant, and n is the principal quantum number of the higher energy level.
Step 5: Finalize the Diagram
Make sure the diagram is clear and all energy levels and transitions are properly labeled. The energy levels should be spaced apart to indicate that higher levels have more energy.
The energy levels in a hydrogen atom are represented by the principal quantum number n. For the Balmer series, we focus on transitions where the electron falls to the n=2 level from higher energy levels (n=3,4,5,…).
1. Draw horizontal lines to represent the energy levels. Label them as follows:
- n=1 (ground state)
- n=2 (first excited state, where transitions for the Balmer series occur)
- n=3 (second excited state)
- n=4 (third excited state)
- n=5 (fourth excited state)
- Continue this pattern for higher levels if needed.
Draw arrows to indicate the transitions from higher energy levels down to n=2:
- From n=3 to n=2
- From n=4 to n=2
- From n=5 to n=2
Label each transition with the corresponding wavelength (or frequency) of the emitted light. The wavelengths can be calculated using the Rydberg formula:
1λ=RH(122−1n2)
Where RH is the Rydberg constant, and n is the principal quantum number of the higher energy level.
Make sure the diagram is clear and all energy levels and transitions are properly labeled. The energy levels should be spaced apart to indicate that higher levels have more energy.
Similar Questions
Using Bohr's postulates, obtain the expressions for (i) kinetic energy and (ii) potential energy of the electron in stationary state of hydrogen atom.
Draw the energy level diagram showing how the transitions between energy levels result in the appearance of Lymann Series.
View SolutionUsing Bohr's postulates, obtain the expression for the total energy of the electron in the stationary states of the hydrogen atom. Hence draw the energy level diagram showing how the line spectra corresponding to Balmer series occur due to transition between energy levels.
View SolutionDraw energy level diagram for hydrogen atom, showing first four energy levels corresponding to n = 1,2, 3 and 4. Show transitions responsible for :
Emission spectrum of Balmer series.
View SolutionDraw energy level diagram for hydrogen atom, showing first four energy levels corresponding to n = 1,2, 3 and 4. Show transitions responsible for :
Absorption spectrum of Lyman series.
View SolutionDraw energy level diagram for Hydrogen atom showing at least four lowest energy levels. Show the transitions responsible for emission of Balmer series.
View SolutionThe figure shows an energy level diagram for the hydrogen atom. Several transitions are marked as I, II, III,_____. The diagram is only indicative and not be scale.

In which transitions is a Balmer photn absorbed?
View SolutionThe figure shows an energy level diagram for the hydrogen atom. Several transitions are marked as I,II,III ,______, the diagram is only indicative and not to scale.
_E01_150_Q01.png) .
.
Which transition involves the longest wavelength line in the visible portion of the hydrogen spectrum
View SolutionThe figure shows an energy level diagram for the hydrogen atom. Several transitions are marked as I, II, III,_____. The diagram is only indicative and not be scale.

Which transition will occur when a hydrogen atom is irradiated with radiation of wavelength 103nm.
View SolutionThe figure shows an energy level diagram for the hydrogen atom. Several transitions are marked as I, II, III,_____. The diagram is only indicative and not be scale.

Which transition will occur when a hydrogen atom is irradiated with radiation of wavelength 103nm.
View SolutionDraw the energy level diagram of hydrogen atom and show the transitions responsible for :
(i) absorption lines of Lyman series.
(ii) emission lines of Balmer series.
View Solution
