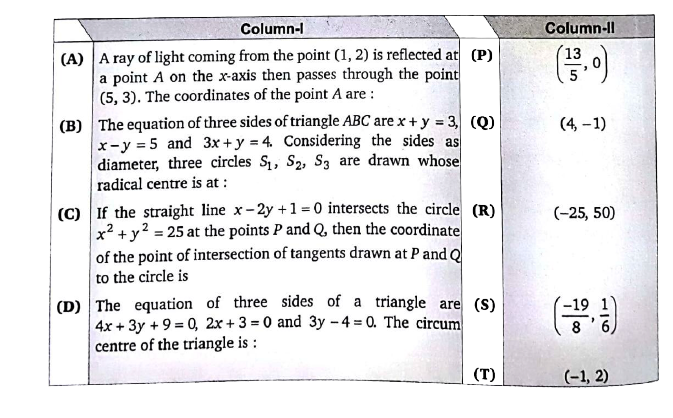
The correct Answer is:A→P;B→Q;C→R;D→S
Step by step video & image solution for by Maths experts to help you in doubts & scoring excellent marks in Class 12 exams.
Topper's Solved these Questions
- BOOK - VIKAS GUPTA (BLACK BOOK) ENGLISHCHAPTER - CIRCLEEXERCISE - Exercise - 5 : Subjective Type Problems13videos
CIRCLE
- BOOK - VIKAS GUPTA (BLACK BOOK) ENGLISHCHAPTER - CIRCLEEXERCISE - Exercise - 3 : Comprehension Type Problems8videos
CIRCLE
- BOOK - VIKAS GUPTA (BLACK BOOK) ENGLISHCHAPTER - BIONMIAL THEOREMEXERCISE - Exercise-4 : Subjective Type Problems15videos
BIONMIAL THEOREM
- BOOK - VIKAS GUPTA (BLACK BOOK) ENGLISHCHAPTER - COMPLEX NUMBERSEXERCISE - EXERCISE-5 : SUBJECTIVE TYPE PROBLEMS8videos
COMPLEX NUMBERS
Similar Questions
Tangents are drawn to circle x2+y2=1 at its iontersection points (distinct) with the circle x2+y2+(λ−3)x+(2λ+2)y+2=0. The locus of intersection of tangents is a straight line, then the slope of that straight line is .
01:37View SolutionLet the circles
S1≡x2+y2+4y−1=0
S2≡x2+y2+6x+y+8=0
touch each other . Also, let P1 be the point of contact of S1 and S2, C1 and C2 are the centres of S1andS2 respectively.
The coordinates of P1 are06:07View SolutionThe sum of series 3⋅2007C0−8⋅2007C1+13⋅2007C2−18⋅2007C3+…… upto 2008 terms is K, then K is :
02:11View SolutionLet complex number 'z' satisfy the inequality 2≤|x|≤4. A point P is selected in this region at random. The probability that argument of P lies in the interval [−π4,π4] is 1K, then K =
01:31View SolutionHow many lines of symmetry does the above figure have ?
02:45View SolutionWhich of the following are correct chain isomers of butane ? (i)
02:17View SolutionDetermine the point of symmetry of a regular hexagon.
05:41View SolutionDtermine the images of the following figure about the given line :
02:21View SolutionMatch the following Column A to Column B
 02:03View Solution
Match the following Column A to Column B
 02:10View Solution
Match the following Column A to Column B
 02:17View Solution
Find the area of the figure given below.
 02:10View Solution
The area of the shaded part in the figure given below is ______.
 04:23View Solution
The inequation represented by the graph given below is :
01:13View SolutionThe inequation that best describes the graph given below is _________
03:12View SolutionThe inequation that best describes the following graph is _________
05:46View Solution


