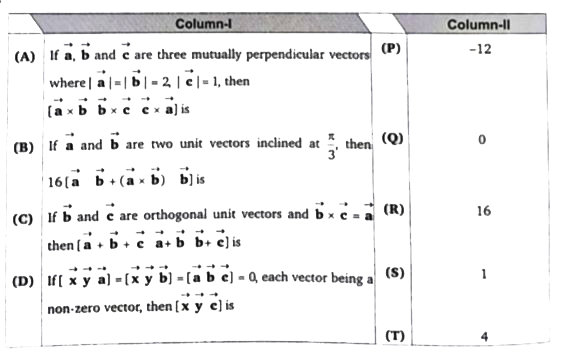
The correct Answer is:A→R;B→P;C→S;D→Q
Step by step video & image solution for by Maths experts to help you in doubts & scoring excellent marks in Class 12 exams.
Updated on:21/07/2023Topper's Solved these Questions
- VECTOR & 3DIMENSIONAL GEOMETRYBOOK - VIKAS GUPTA (BLACK BOOK) ENGLISHCHAPTER - VECTOR & 3DIMENSIONAL GEOMETRYEXERCISE - Exercise-5 : Subjective Type Problems
16 Videos
- VECTOR & 3DIMENSIONAL GEOMETRYBOOK - VIKAS GUPTA (BLACK BOOK) ENGLISHCHAPTER - VECTOR & 3DIMENSIONAL GEOMETRYEXERCISE - Exercise-3 : Comprehension Type Problems
12 Videos
- TRIGONOMETRIC EQUATIONS BOOK - VIKAS GUPTA (BLACK BOOK) ENGLISHCHAPTER - TRIGONOMETRIC EQUATIONS EXERCISE - Exercise-5 : Subjective Type Problems
9 Videos
Similar Questions
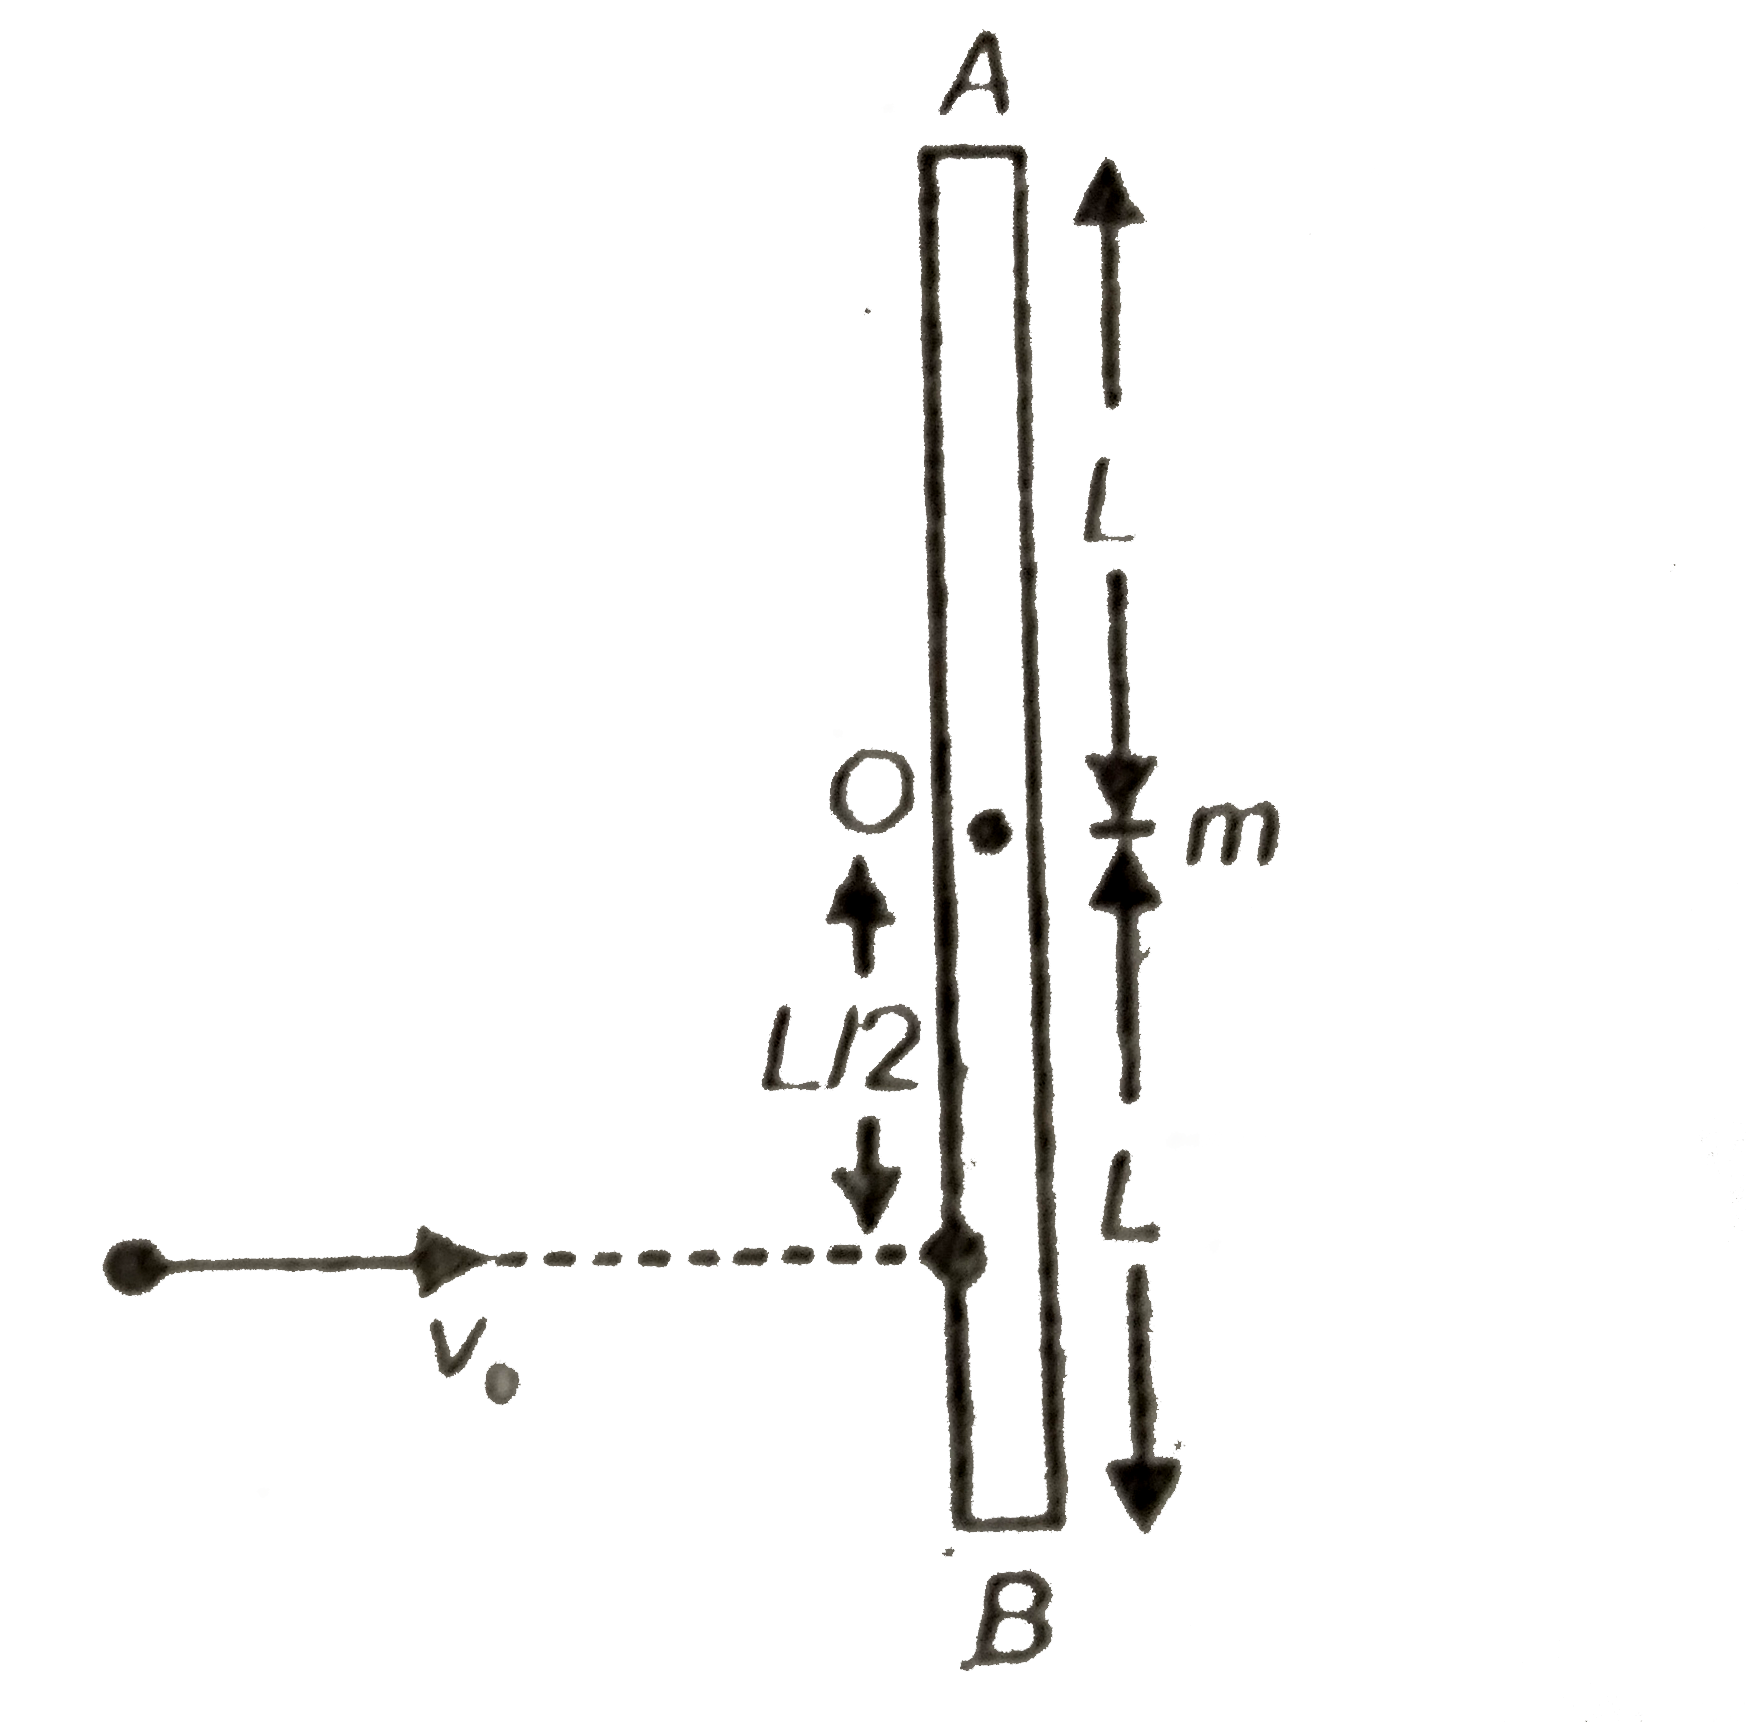
A rod AB of length 2L and mass m is lying on a horizontal frictionless surface. A particle of same mass m travelling along the surface hits the rod at distance L2 from COM with a velocity v0 in a direction perpendicular to rod and sticks to it.

Distance of point P on rod from B which is at rest immediately afte collision is
View SolutionThe vertices of ΔABC are A(2, 0, 0), B(0, 1, 0), C(0, 0, 2). Its orthocentre is H and circumcentre is S. P is a point equidistant from A, B, C and the origin O.
Q. The z-coordinate of H is :
View SolutionFind the number of solutions of the equations
(sinx−1)3+(cosx−1)3+(sinx)3=(2sinx+cosx−2)3 in (0,2π).
View SolutionHow many lines of symmetry does the above figure have ?
View SolutionWhich of the following are correct chain isomers of butane ? (i)
View SolutionDetermine the point of symmetry of a regular hexagon.
View SolutionDtermine the images of the following figure about the given line :
View SolutionMatch the following Column A to Column B

View SolutionMatch the following Column A to Column B

View SolutionMatch the following Column A to Column B

View SolutionFind the area of the figure given below.

View SolutionThe area of the shaded part in the figure given below is ______.

View SolutionThe inequation represented by the graph given below is :
View SolutionThe inequation that best describes the graph given below is _________
View SolutionThe inequation that best describes the following graph is _________
View SolutionWhich inequations represent the shaded region in the given figure
View Solution

