Consider the given figure showing the formation of H+2 ion depending on intermuclear distance versus potential energy of the system.
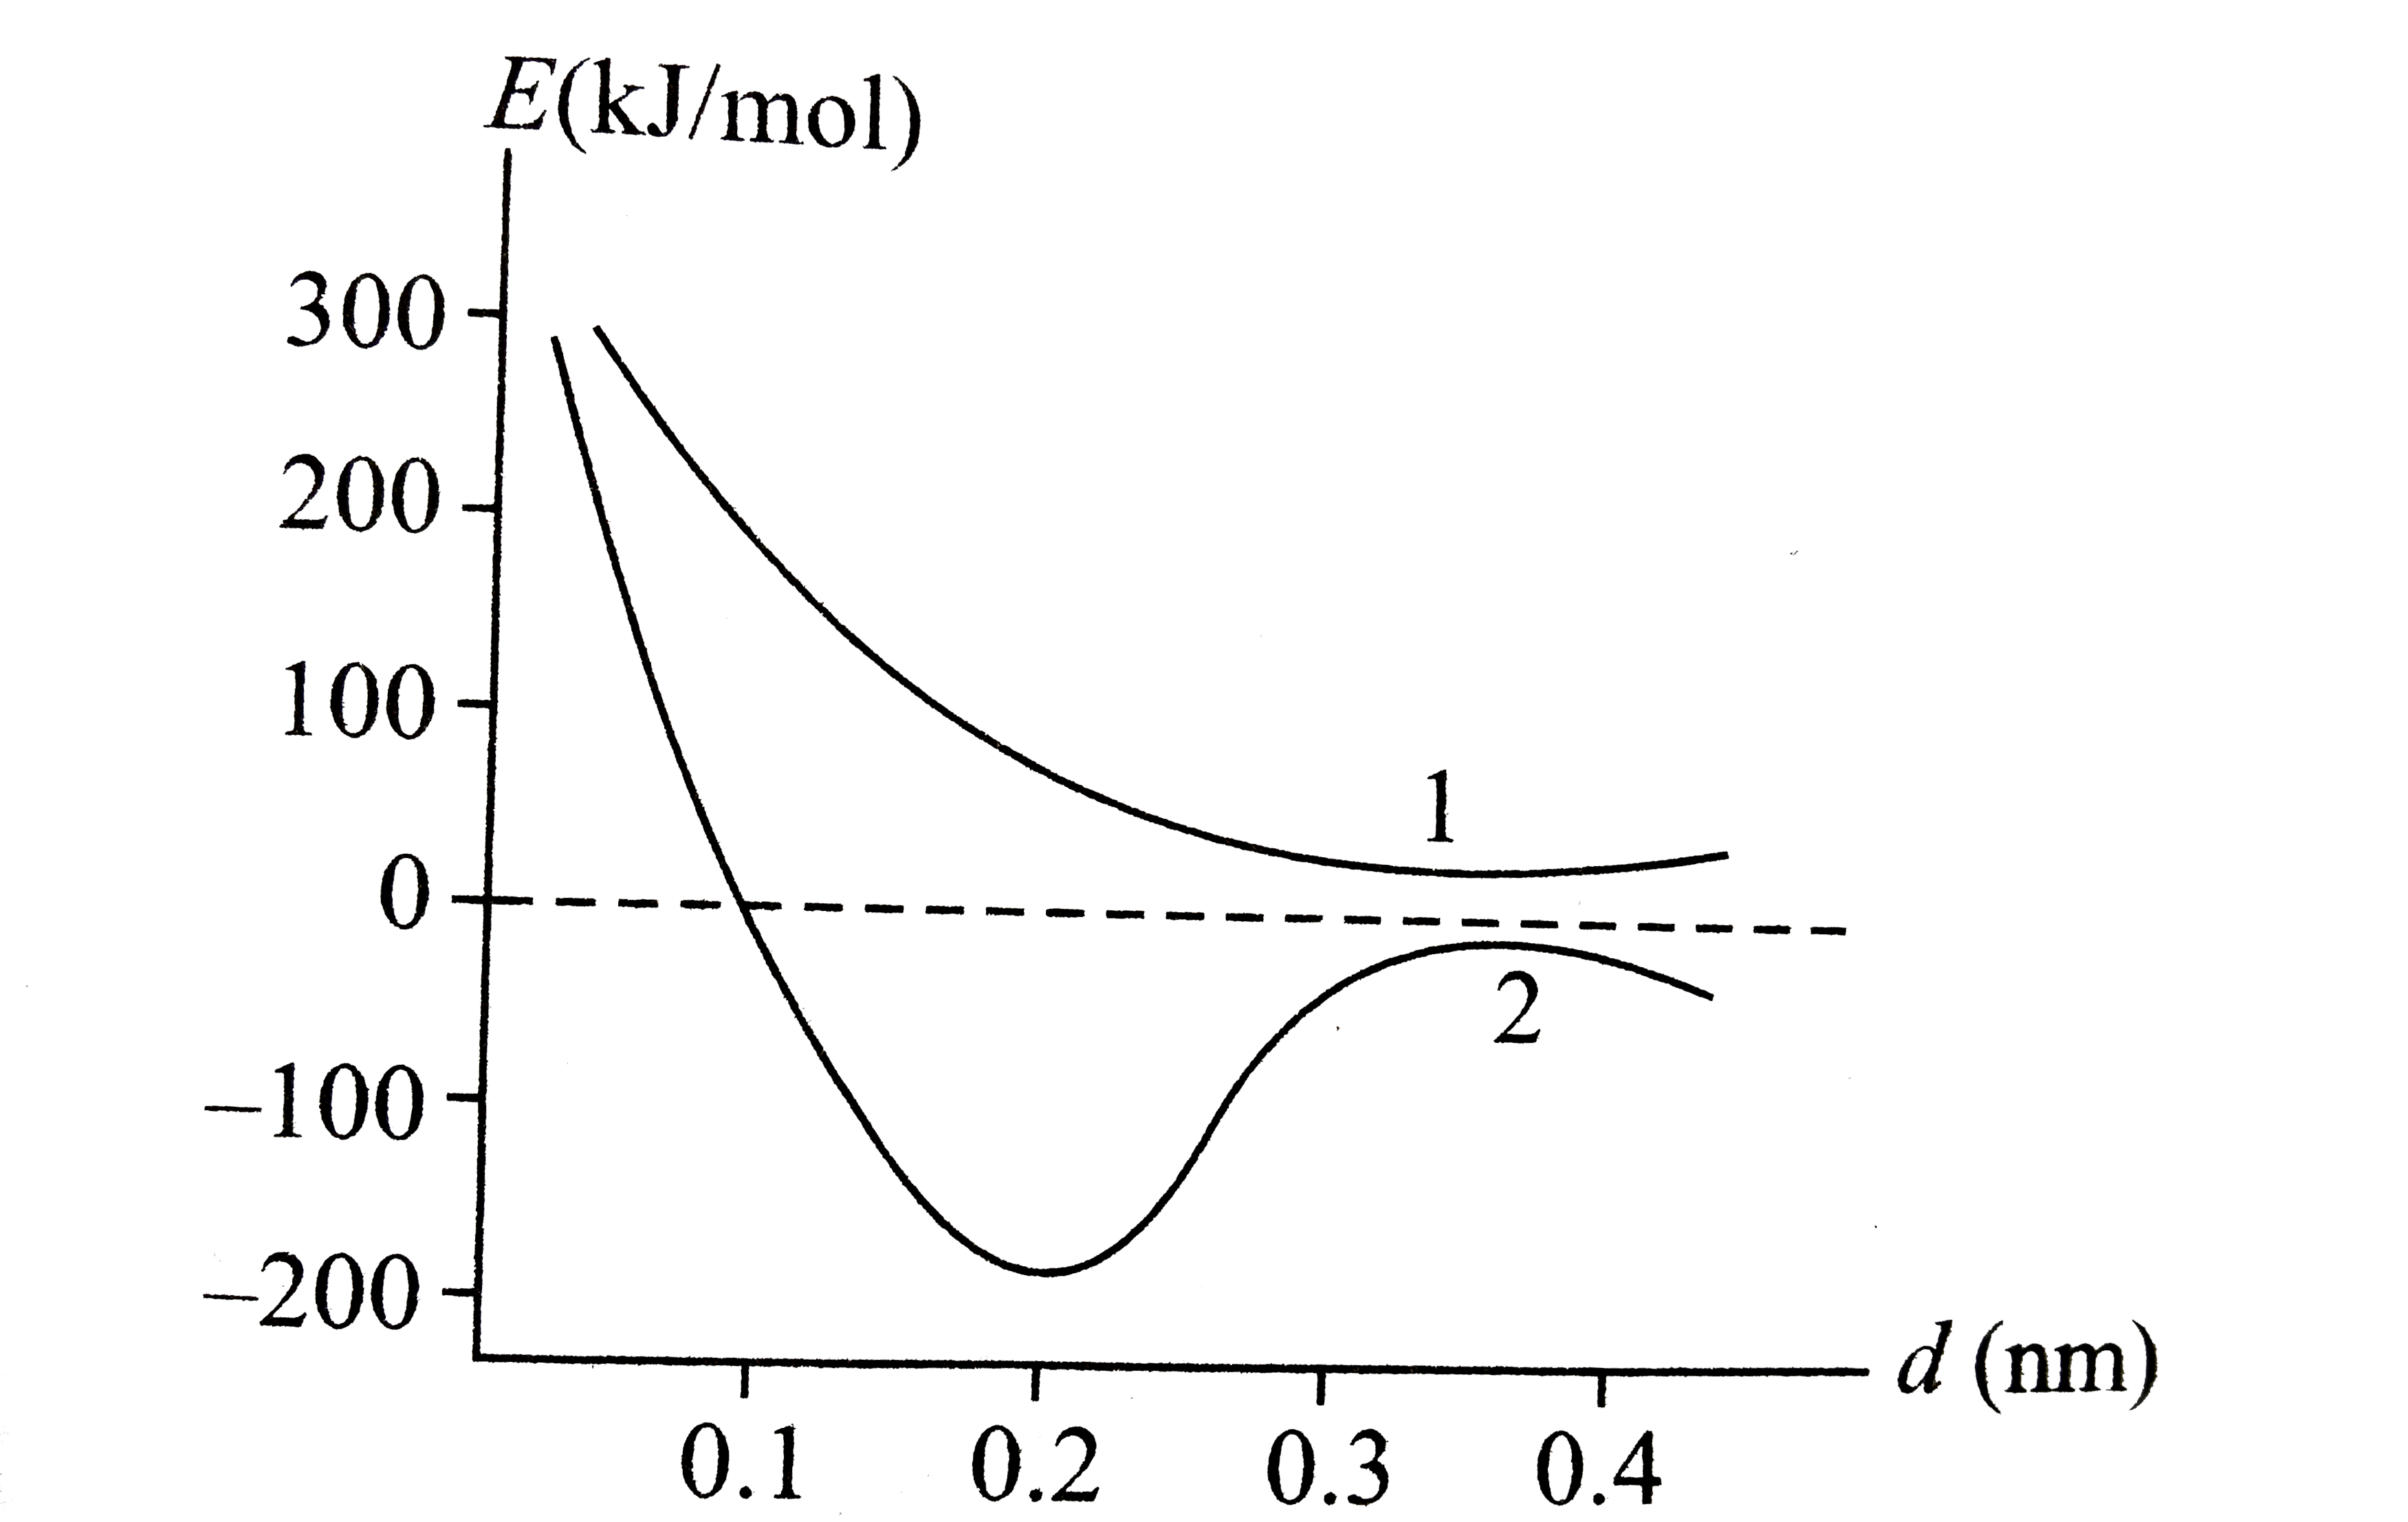
Curve-1 represents the most stable state of the system for H+2
Curve-2 represents the most stable state of the system for H+2
Curve-1 indicates that the molecular hydrogen ion is formed
Curve-2 represents the energy level of the antibonding region
The correct Answer is:B
Step by step video & image solution for Consider the given figure showing the formation of H_(2)^(+) ion depending on intermuclear distance versus potential energy of the system. by Chemistry experts to help you in doubts & scoring excellent marks in Class 12 exams.
Updated on:21/07/2023Topper's Solved these Questions
- CHEMICAL BONDING (ADVANCED)BOOK - VK JAISWAL ENGLISHCHAPTER - CHEMICAL BONDING (ADVANCED)EXERCISE - Level 3
77 Videos
- CHEMICAL BONDING (ADVANCED)BOOK - VK JAISWAL ENGLISHCHAPTER - CHEMICAL BONDING (ADVANCED)EXERCISE - ONE OR MORE ANSWER IS/ARE CORRECT
78 Videos
- CHEMICAL BONDING (ADVANCED)BOOK - VK JAISWAL ENGLISHCHAPTER - CHEMICAL BONDING (ADVANCED)EXERCISE - SUBJECTIVE PROBLEMS
64 Videos
- CHEMICAL BONDING (BASIC)BOOK - VK JAISWAL ENGLISHCHAPTER - CHEMICAL BONDING (BASIC)EXERCISE - SUBJECTIVE PROBLEMS
54 Videos
Similar Questions
Knowledge Check
During the formation of a chemical bond potential energy of the system
AincreasesBdecreasesCneither increases nor decreasesDremains constant.
Three solid sphere of mass M and radius R are placed in contact as shown in figure. Find the potential energy of the system ?
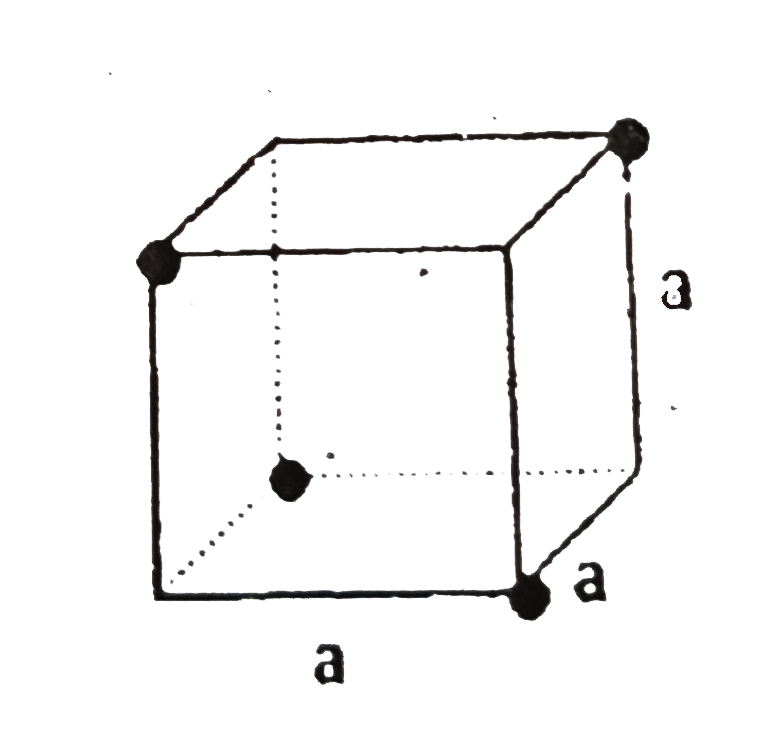
View SolutionFigure shows 4 identical masses of mass m, arranged on a cube as shown.
The potential energy of the system is
View SolutionThe potential energy curve for the H2 molecule as a function of internuclear distance is :
View Solution_2019_CBT3_E01_056_Q01.png)
three point charge −q,q and Q are arranged as given in figure. If d is distance from centre of −q and +q to Q and d>>>a then the potential energy of given system is
View SolutionThe given plot shows the variation of U, the potential energy of interaction between two particles with the distance separating them r,
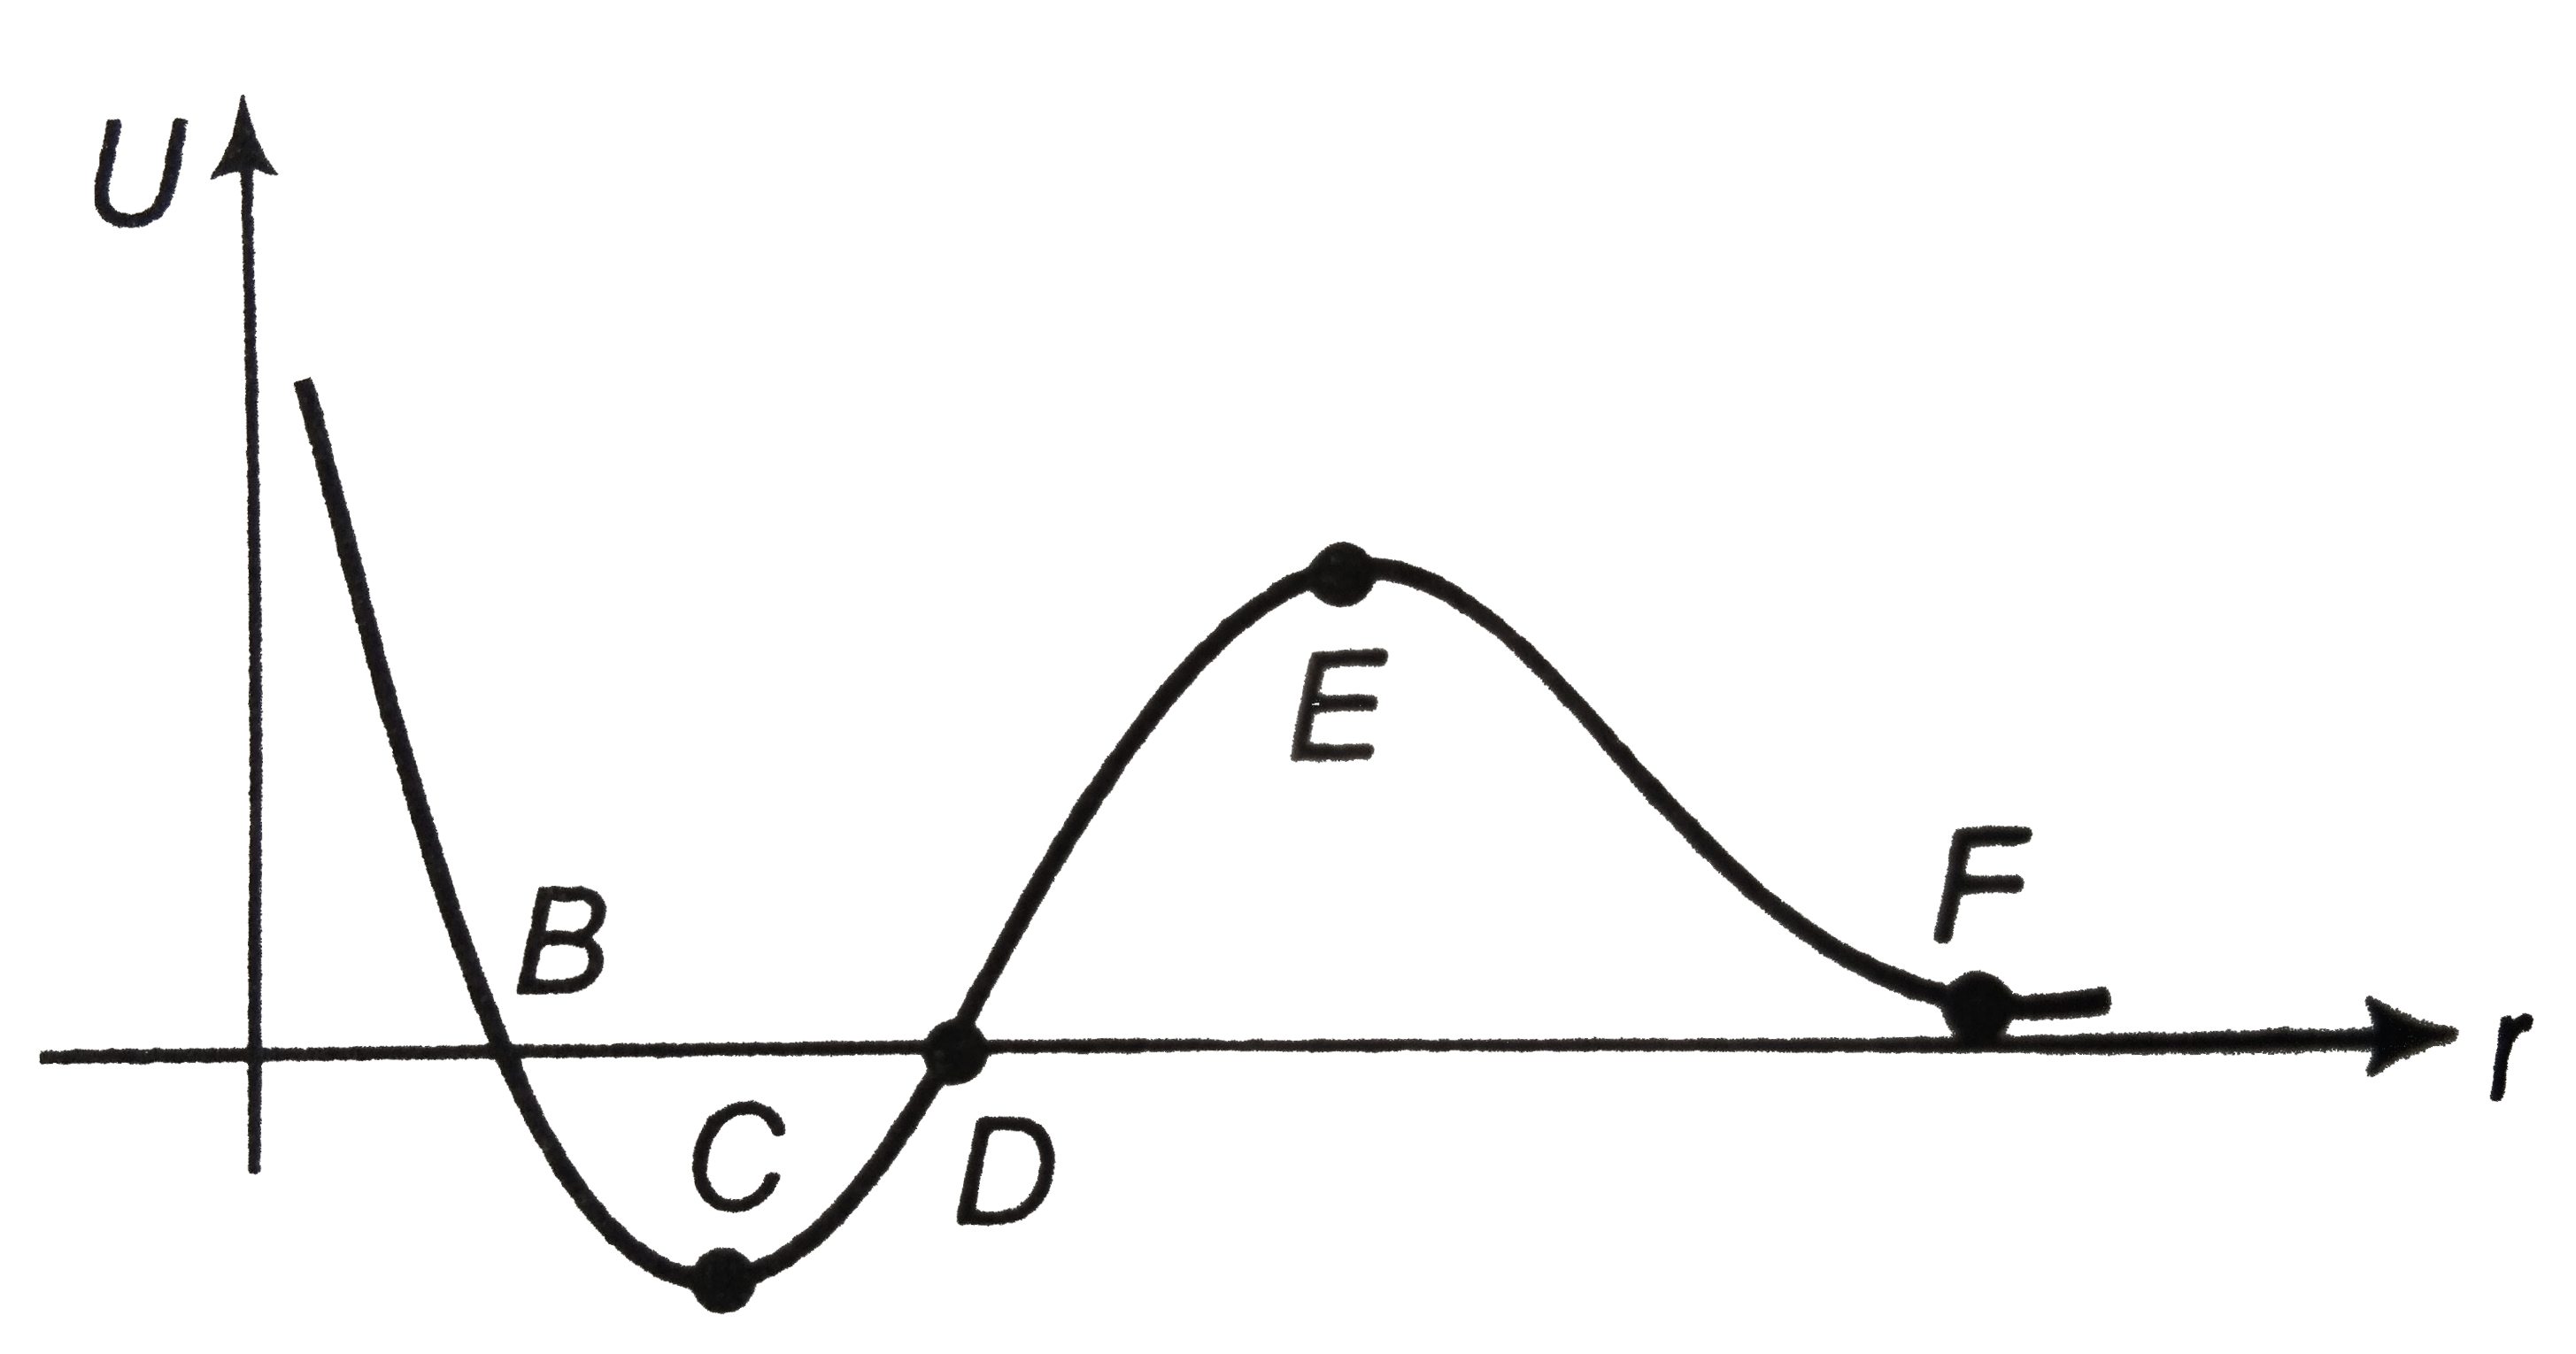
View SolutionThe given plot shows the variation of U, the potential energy of interaction between two particles with the distance separating them r,

View SolutionThree charges +q , +q, and Q are placed at the comers of a right angled isosceles triangle as shown in the figure. If the net potential energy of the system is zero then value of Q is
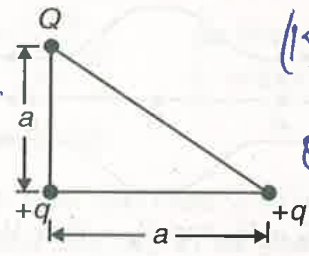
View Solution

