For a sponaneous reaction, the free energy change must be negative, ΔG=ΔH−TΔS,ΔH is the enthalpy change during the reaction. T is the absolute temperature, and ΔS is the change in entropy during the reaction. Consider a reaction such as the formation of an oxide
M+O2→MO
Dioxygen is used up in the course of this reaction. Gases have a more random structure (less ordered) than liquid or solids. Consequently gases have a higher entropy than liquids and solids. In this reaction S (entropy or randomness) decreases, hence ΔS is negative. Thus, if the temperature is raised then TΔS becomes more negative,Since, TΔS is substracted in the equation, then ΔG becomes less negative. Thus, the free energy change increases with the increase in temperature.
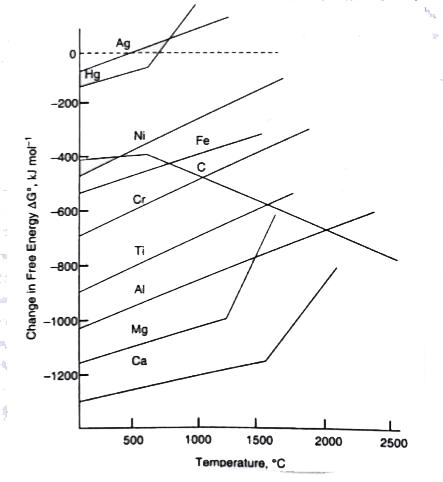
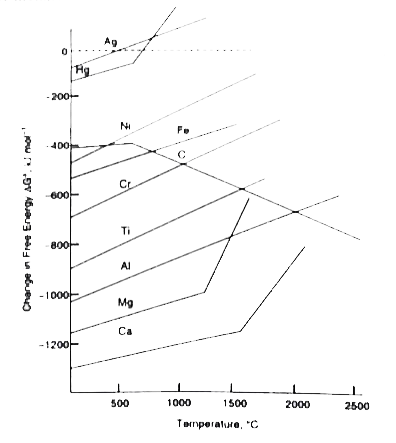
The free energy changes that occur when one mole of common reactant (in this case dioxygen) is used may be plotted graphically aginst temperature for a number of reactions of metals to their oxides. The following plot is called an Ellingham diagram for metal oxide. Understanding of Ellingham diagram is extremely important for the efficient extraction of metals.

As per the Ellingham diagram of oxides which of the following conclusion is true ?
Al reduces Fe2O3, whereas MgO cannot be reduced by Al at 1500∘C
Fe reduces Al2O3, whereas MgO cannot be reduced by Al at 1500∘C
Al reduces Fe2O3, whereas MgO cannot be reduced by Ca at 1500∘C
Al can reduce both Fe2O3 and MgO to the corresponding metal at 1500∘C
The correct Answer is:A
Step by step video & image solution for For a sponaneous reaction, the free energy change must be negative, Delta G=Delta H-T Delta S, Delta H is the enthalpy change during the reaction. T is the absolute temperature, and Delta S is the change in entropy during the reaction. Consider a reaction such as the formation of an oxide M+O_(2) to MO Dioxygen is used up in the course of this reaction. Gases have a more random structure (less ordered) than liquid or solids. Consequently gases have a higher entropy than liquids and solids. In this reaction S (entropy or randomness) decreases, hence Delta S is negative. Thus, if the temperature is raised then T Delta S becomes more negative,Since, TDelta S is substracted in the equation, then Delta G becomes less negative. Thus, the free energy change increases with the increase in temperature. The free energy changes that occur when one mole of common reactant (in this case dioxygen) is used may be plotted graphically aginst temperature for a number of reactions of metals to their oxides. The following plot is called an Ellingham diagram for metal oxide. Understanding of Ellingham diagram is extremely important for the efficient extraction of metals. As per the Ellingham diagram of oxides which of the following conclusion is true ? by Chemistry experts to help you in doubts & scoring excellent marks in Class 12 exams.
Updated on:21/07/2023Topper's Solved these Questions
- METALLURGYBOOK - VK JAISWAL ENGLISHCHAPTER - METALLURGYEXERCISE - Level 3 (Passive 2)
6 Videos
- METALLURGYBOOK - VK JAISWAL ENGLISHCHAPTER - METALLURGYEXERCISE - Level 3 (Passive 3)
6 Videos
- METALLURGYBOOK - VK JAISWAL ENGLISHCHAPTER - METALLURGYEXERCISE - Level 2
86 Videos
- ENVIRONMENTAL CHEMISTRYBOOK - VK JAISWAL ENGLISHCHAPTER - ENVIRONMENTAL CHEMISTRYEXERCISE - ASSERTION-REASON TYPE QUESTIONS
14 Videos
- p-BLOCK ELEMENTSBOOK - VK JAISWAL ENGLISHCHAPTER - p-BLOCK ELEMENTSEXERCISE - SUBJECTIVE PROBLEMS
35 Videos
Similar Questions
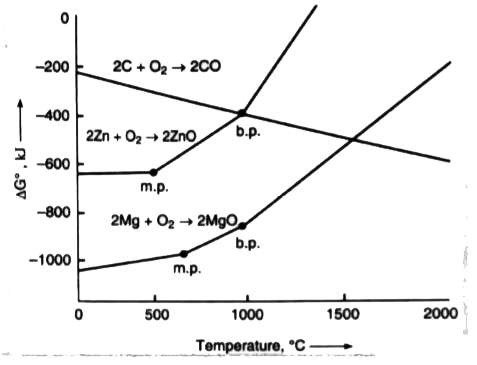
The ellingham diagram for zinc, magnesium and carbon coverting into correspondingoxides is shown below.

At what temperature, zinc and carbon have equal affinity for oxygen ?
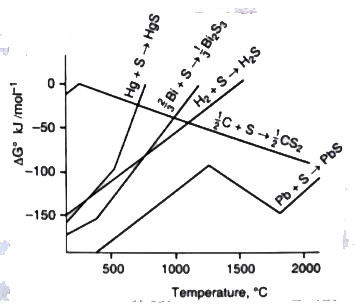
View SolutionThe Ellingham diagram for a number of metallic sulphides is shown below.

Formation of which of the sulphides is most spontaneous ?
View SolutionWhich of the following pair of ores cannot be converted into corresponding metals by pyrometallurgy ?
View SolutionAssertion (A) Green house effect was observed in houses used to grow plants and these are made of green glass.
Reason (R) Green house name has been given because glass houses are made of green glass.
View SolutionIn phosphorus acid, If X is number of non-bonding electron pairs. Y is number of σ-bonds and Z is number of π-bonds. Then calculate value of "YxZ-X".
View SolutionIf for the reaction,
2Mg(s)+O2(g)→2MgO(s), at 27∘C ΔrH=−1202kJmol−1 and ΔrS=−217kJ−1mol−1. The total entropy change (ΔS)T and Gibb's energy change during the course of reaction (ΔrG) are respectively:
View SolutionThe change in entropy, Delta S is positive for an endothermic reaction, if enthalpy change Delta H occurs at the same temperature T, then the reaction is feasible
View SolutionIn the reaction A^(+) + B rarr A+ B^(+) , there is no entropy change. Enthalpy change, Delta H equals 22 kJ mol^(-1) of A^(+) . Calculate the DeltaG for the reaction . Under what condition free energy change will have negative value ?
View SolutionFor a sponaneous reaction, the free energy change must be negative, ΔG=ΔH−TΔS,ΔH is the enthalpy change during the reaction. T is the absolute temperature, and ΔS is the change in entropy during the reaction. Consider a reaction such as the formation of an oxide
M+O2→MO
Dioxygen is used up in the course of this reaction. Gases have a more random structure (less ordered) than liquid or solids. Consequently gases have a higher entropy than liquids and solids. In this reaction S (entropy or randomness) decreases, hence ΔS is negative. Thus, if the temperature is raised then TΔS becomes more negative,Since, TΔS is substracted in the equation, then ΔG becomes less negative. Thus, the free energy change increases with the increase in temperature.
The free energy changes that occur when one mole of common reactant (in this case dioxygen) is used may be plotted graphically aginst temperature for a number of reactions of metals to their oxides. The following plot is called an Ellingham diagram for metal oxide. Understanding of Ellingham diagram is extremely important for the efficient extraction of metals.

For the conversion of Ca(s) to Ca(s) which of the following represent the ΔG vs. T ?
View SolutionFor a sponaneous reaction, the free energy change must be negative, ΔG=ΔH−TΔS,ΔH is the enthalpy change during the reaction. T is the absolute temperature, and ΔS is the change in entropy during the reaction. Consider a reaction such as the formation of an oxide
M+O2→MO
Dioxygen is used up in the course of this reaction. Gases have a more random structure (less ordered) than liquid or solids. Consequently gases have a higher entropy than liquids and solids. In this reaction S (entropy or randomness) decreases, hence ΔS is negative. Thus, if the temperature is raised then TΔS becomes more negative,Since, TΔS is substracted in the equation, then ΔG becomes less negative. Thus, the free energy change increases with the increase in temperature.
The free energy changes that occur when one mole of common reactant (in this case dioxygen) is used may be plotted graphically aginst temperature for a number of reactions of metals to their oxides. The following plot is called an Ellingham diagram for metal oxide. Understanding of Ellingham diagram is extremely important for the efficient extraction of metals.

For the conversion of Ca(s) to Ca(s) which of the following represent the ΔG vs. T ?
View SolutionFor a sponaneous reaction, the free energy change must be negative, Delta G=Delta H-T Delta S, Delta H is the enthalpy change during the reaction. T is the absolute temperature, and Delta S is the change in entropy during the reaction. Consider a reaction such as the formation of an oxide M+O_(2) to MO Dioxygen is used up in the course of this reaction. Gases have a more random structure (less ordered) than liquid or solids. Consequently gases have a higher entropy than liquids and solids. In this reaction S (entropy or randomness) decreases, hence Delta S is negative. Thus, if the temperature is raised then T Delta S becomes more negative,Since, TDelta S is substracted in the equation, then Delta G becomes less negative. Thus, the free energy change increases with the increase in temperature. The free energy changes that occur when one mole of common reactant (in this case dioxygen) is used may be plotted graphically aginst temperature for a number of reactions of metals to their oxides. The following plot is called an Ellingham diagram for metal oxide. Understanding of Ellingham diagram is extremely important for the efficient extraction of metals. Free energy change of Hg and Mg for the convertion to oxides the slpe of Delta G vsT has been changed above the boiling points of the given metal because :
View SolutionFor a sponaneous reaction, the free energy change must be negative, Delta G=Delta H-T Delta S, Delta H is the enthalpy change during the reaction. T is the absolute temperature, and Delta S is the change in entropy during the reaction. Consider a reaction such as the formation of an oxide M+O_(2) to MO Dioxygen is used up in the course of this reaction. Gases have a more random structure (less ordered) than liquid or solids. Consequently gases have a higher entropy than liquids and solids. In this reaction S (entropy or randomness) decreases, hence Delta S is negative. Thus, if the temperature is raised then T Delta S becomes more negative,Since, TDelta S is substracted in the equation, then Delta G becomes less negative. Thus, the free energy change increases with the increase in temperature. The free energy changes that occur when one mole of common reactant (in this case dioxygen) is used may be plotted graphically aginst temperature for a number of reactions of metals to their oxides. The following plot is called an Ellingham diagram for metal oxide. Understanding of Ellingham diagram is extremely important for the efficient extraction of metals. Which of the following elements can be prepared by heating the oxide above 400^(@)C ?
View SolutionFor a sponaneous reaction, the free energy change must be negative, Delta G=Delta H-T Delta S, Delta H is the enthalpy change during the reaction. T is the absolute temperature, and Delta S is the change in entropy during the reaction. Consider a reaction such as the formation of an oxide M+O_(2) to MO Dioxygen is used up in the course of this reaction. Gases have a more random structure (less ordered) than liquid or solids. Consequently gases have a higher entropy than liquids and solids. In this reaction S (entropy or randomness) decreases, hence Delta S is negative. Thus, if the temperature is raised then T Delta S becomes more negative,Since, TDelta S is substracted in the equation, then Delta G becomes less negative. Thus, the free energy change increases with the increase in temperature. The free energy changes that occur when one mole of common reactant (in this case dioxygen) is used may be plotted graphically aginst temperature for a number of reactions of metals to their oxides. The following plot is called an Ellingham diagram for metal oxide. Understanding of Ellingham diagram is extremely important for the efficient extraction of metals. As per the Ellingham diagram of oxides which of the following conclusion is true ?
View SolutionThe change in entropy, ΔS is positive for an endothermic reaction. If enthalpy change ΔH occurs at the same temperature T, then the reaction is feasible
View Solutionकिसी गैसीय अभिक्रिया में यदि ΔH एन्थैल्पी परिवर्तन तथा ΔE आन्तरिक ऊर्जा में परिवर्तन हो तो एक गैसीय अभिक्रिया के लिए
View SolutionFor gaseous reaction, if ΔH is the change in enthalpy and ΔU that in internal energy then :
View Solution
