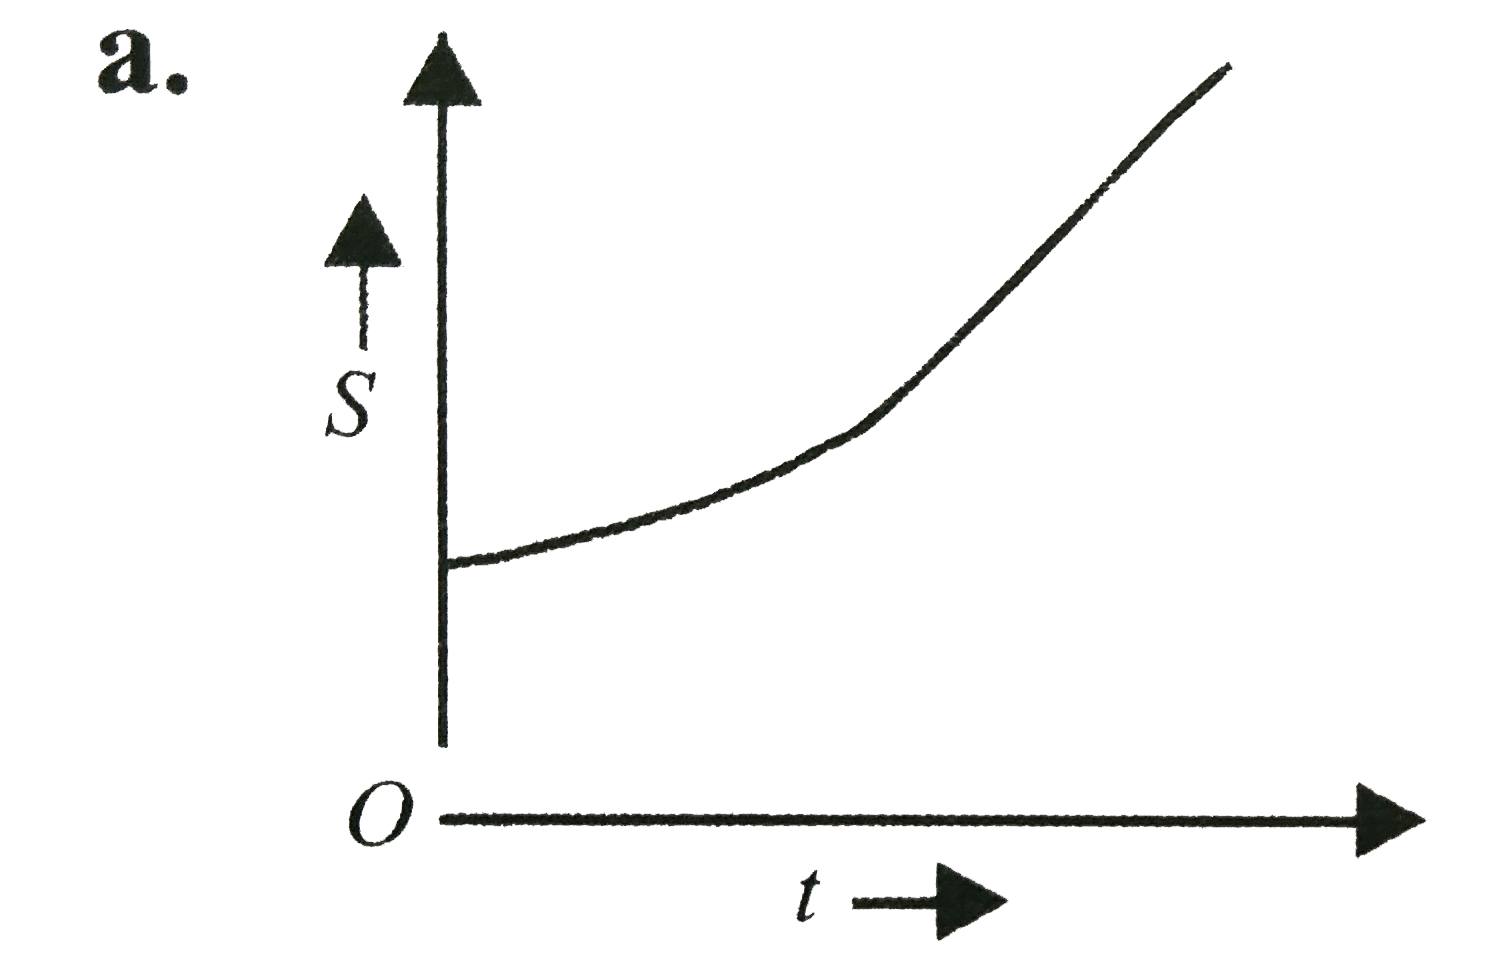
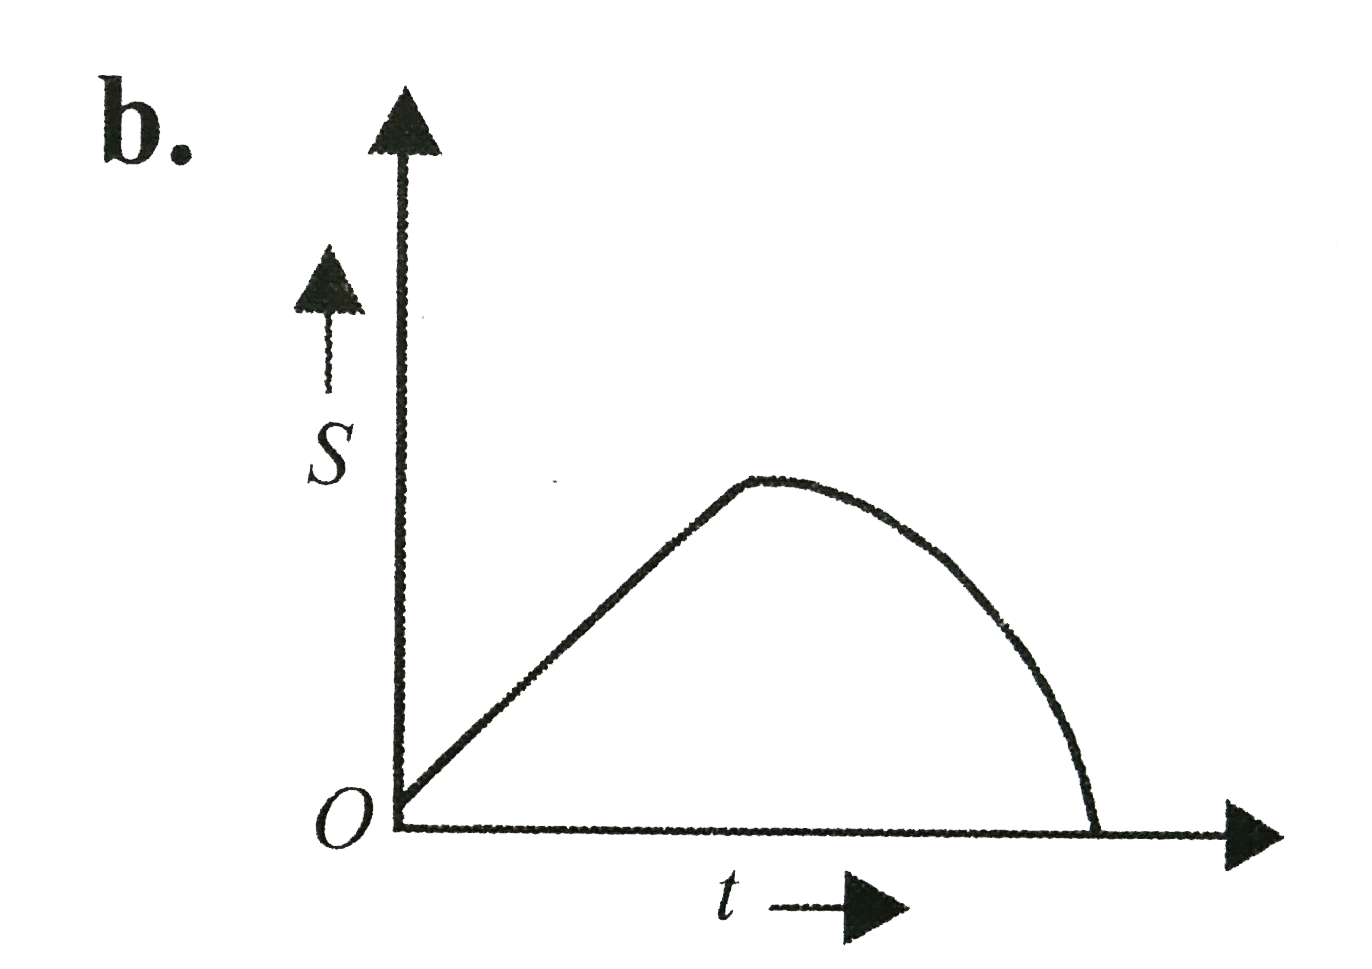
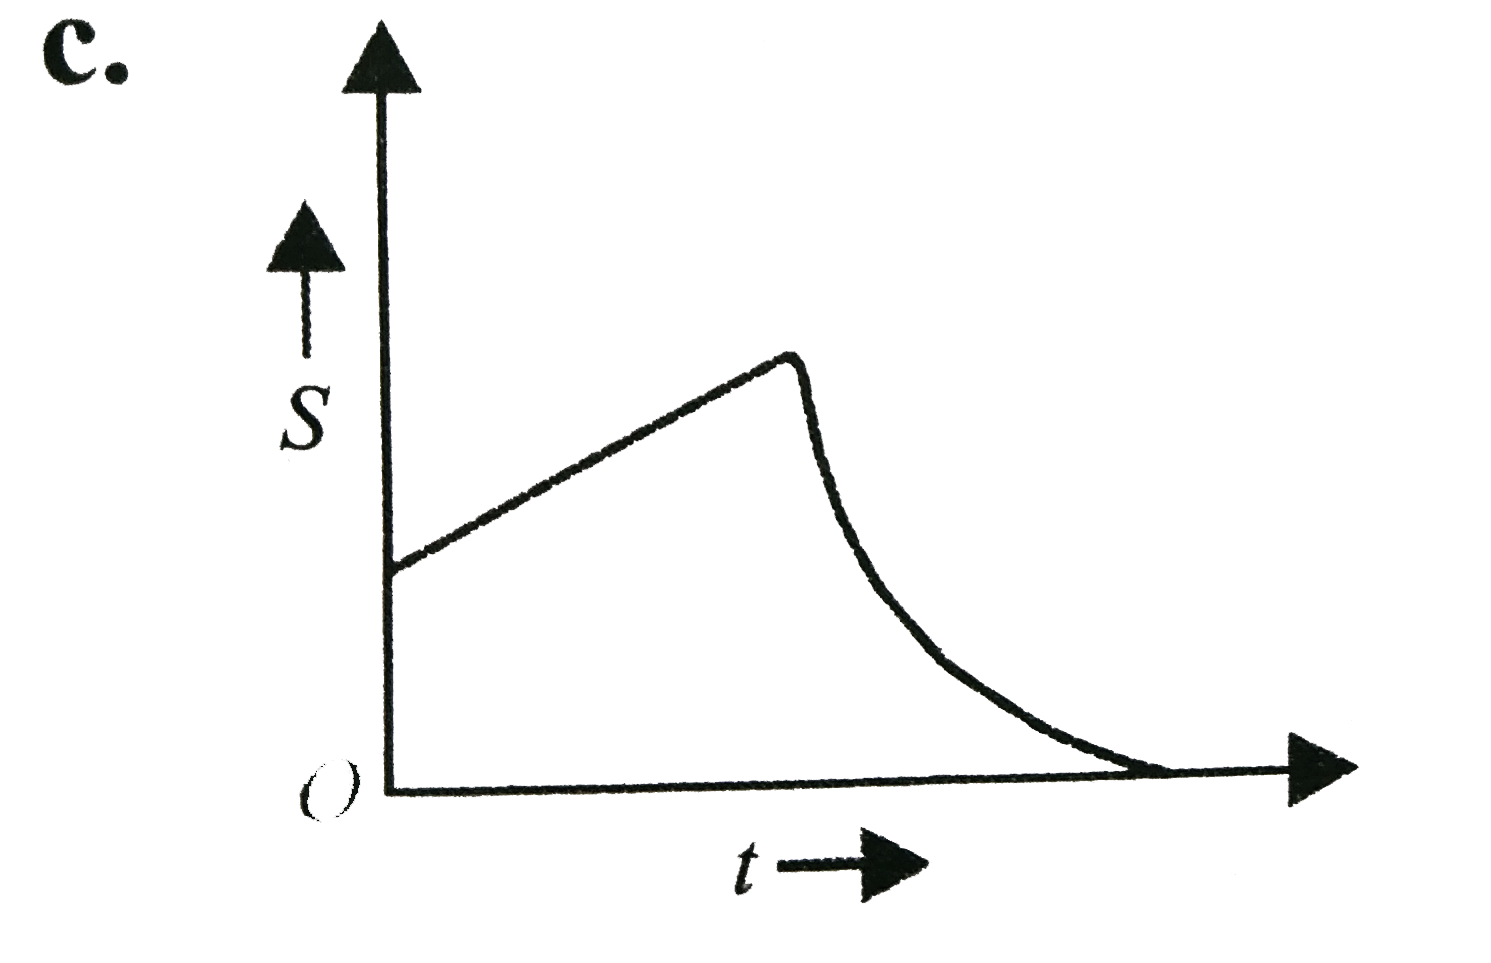
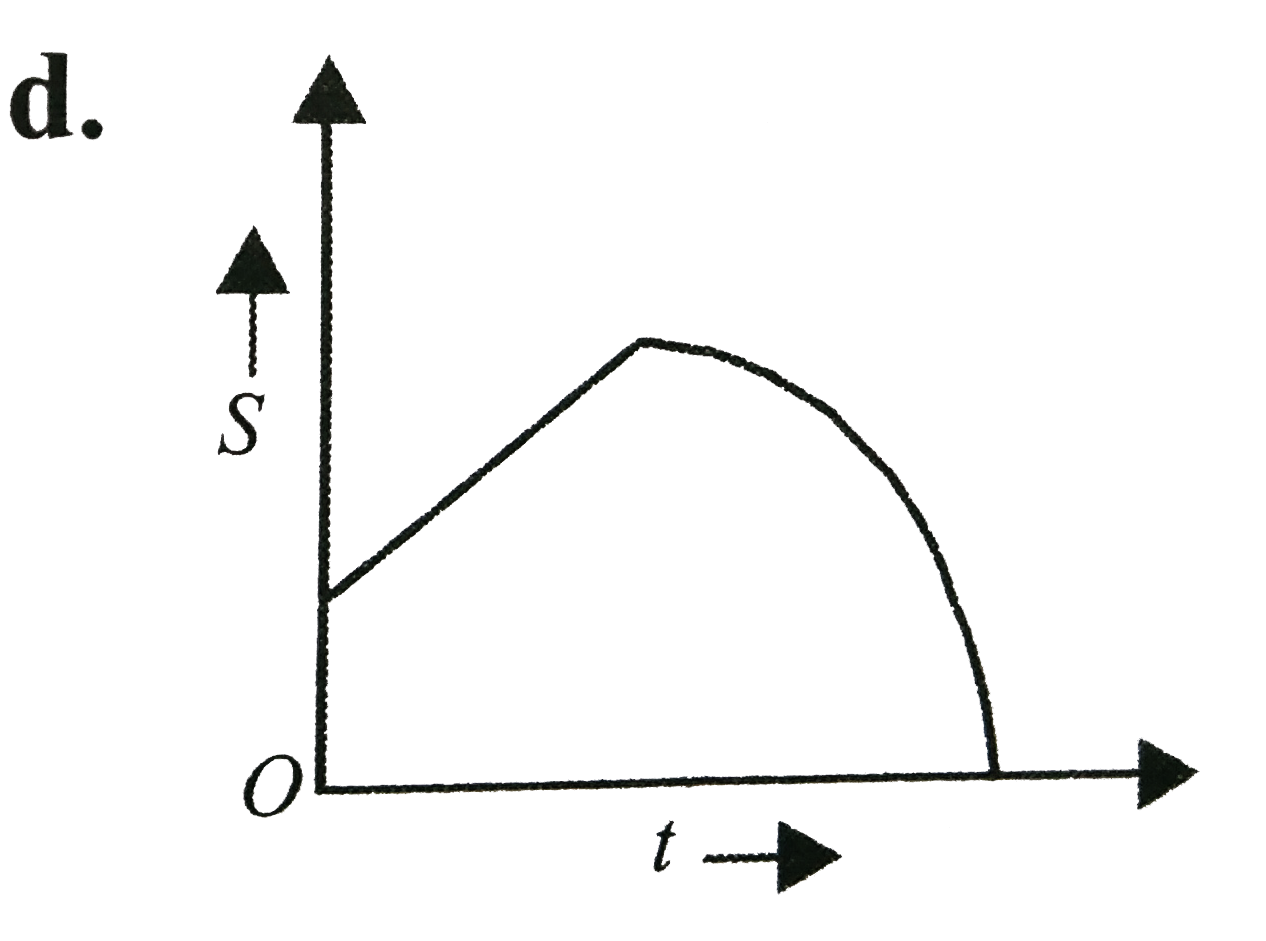
Two balls are dropped from the top of a hight tower with a time interval of t0. Second , where t0 is smaller than the time taken by the first ball to reach the ground which is perfectly inelastic. The distance S between the two balls plotted against the time lapse t from the instant of dropping the second ball, is best tepresented by.
 .
.
 .
.
 .
.
 .
.
The correct Answer is:D
To solve the problem, we need to analyze the motion of two balls dropped from a tower at different times and determine how the distance S between them changes over time after the second ball is dropped.
1. Understanding the Problem:
- Let the first ball be dropped at t=0.
- The second ball is dropped after a time interval t0.
- We need to find the distance S between the two balls as a function of time t after the second ball is dropped.
2. Equations of Motion:
- For the first ball (dropped at t=0):
S_1 = \frac{1}{2} g t^2 \quad \text{(where t is the time since the first ball was dropped)}
- For the second ball (dropped at t=t0):
S_2 = \frac{1}{2} g (t - t_0)^2 \quad \text{(where t is the time since the second ball was dropped)}
3. Calculating the Distance Between the Balls:
- The distance S between the two balls at time t after the second ball is dropped is given by:
S=S1−S2
- Substituting the equations of motion:
S=12g(t0+t)2−12g(t)2
4. Expanding the Equation:
- Expanding S1:
S1=12g(t20+2t0t+t2)
- Thus, we have:
S=12g(t20+2t0t+t2)−12gt2
- Simplifying:
S=12gt20+gt0t
5. Interpreting the Result:
- The distance S is a linear function of t (since S depends on t linearly as gt0t).
- The constant term 12gt20 represents the initial distance between the two balls when the second ball is dropped.
6. Graph Representation:
- The graph of S versus t will be a straight line with a positive slope, starting from a positive value 12gt20 (the initial distance) and increasing linearly with time.
Conclusion:
The distance S between the two balls plotted against the time t from the instant of dropping the second ball is best represented by a linear graph with a positive slope.
- Let the first ball be dropped at t=0.
- The second ball is dropped after a time interval t0.
- We need to find the distance S between the two balls as a function of time t after the second ball is dropped.
- For the first ball (dropped at t=0):
S_1 = \frac{1}{2} g t^2 \quad \text{(where t is the time since the first ball was dropped)}
- For the second ball (dropped at t=t0):
S_2 = \frac{1}{2} g (t - t_0)^2 \quad \text{(where t is the time since the second ball was dropped)}
- The distance S between the two balls at time t after the second ball is dropped is given by:
S=S1−S2
- Substituting the equations of motion:
S=12g(t0+t)2−12g(t)2
- Expanding S1:
S1=12g(t20+2t0t+t2)
- Thus, we have:
S=12g(t20+2t0t+t2)−12gt2
- Simplifying:
S=12gt20+gt0t
- The distance S is a linear function of t (since S depends on t linearly as gt0t).
- The constant term 12gt20 represents the initial distance between the two balls when the second ball is dropped.
- The graph of S versus t will be a straight line with a positive slope, starting from a positive value 12gt20 (the initial distance) and increasing linearly with time.
The distance S between the two balls plotted against the time t from the instant of dropping the second ball is best represented by a linear graph with a positive slope.
Topper's Solved these Questions
- BOOK - CENGAGE PHYSICS ENGLISHCHAPTER - KINEMATICS-1EXERCISE - Graphical cancept1videos
KINEMATICS-1
- BOOK - CENGAGE PHYSICS ENGLISHCHAPTER - KINEMATICS-1EXERCISE - Multiple Correct16videos
KINEMATICS-1
- BOOK - CENGAGE PHYSICS ENGLISHCHAPTER - KINEMATICS-1EXERCISE - Single Correct52videos
KINEMATICS-1
- BOOK - CENGAGE PHYSICS ENGLISHCHAPTER - GRAVITATIONEXERCISE - INTEGER_TYPE1videos
GRAVITATION
- BOOK - CENGAGE PHYSICS ENGLISHCHAPTER - KINEMATICS-2EXERCISE - Exercise Integer9videos
KINEMATICS-2
Similar Questions
A ball is thrown vertically upward with a velocity u from the top of a tower. If it strikes the ground with velocity 3u, the time taken by the ball to reach the ground is
View SolutionA ball dropped from the top of a tower covers a distance 7x in the last second of its journey, where x is the distance covered in the first second. How much time does it take to reach to ground?.
View Solution
Knowledge Check
- Question 1 - Select One
A wooden ball and an iron ball are dropped from the same height h in vaccum. If their radii are the same then the time taken by then to reach the ground are
Aapproximately equalBexactly equalCnot equalDzero - Question 2 - Select One
A body is released form the top of a tower of height h meters. It takes t seconds to reach the ground. Where is the ball at the time t/2 sec ?
Aat h/2 meter from the groundBat h/4 meter from the groundCdepends upon the mass and volume of the ballDat 3h/4 meter from the ground.
A balloon starts from rest from the ground and moves with uniform acceleration g/8. When it reaches a height h a ball is dropped from it. Find the time taken by the ball to reach the ground.
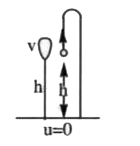 View Solution
A ball is dropped from a tower of height h under gravity. If it takes 4s to reach the ground from height h2, then time taken by it to reach from h to h2 is nearly:
View SolutionA ball is dropped from the top of a tower of height 78.4 m Another ball is thrown down with a certain velocity 2 sec later. If both the balls reach the ground simultaneously, the velocity of the second ball is
View SolutionA body dropped from the top of tower covers a distance 9 x in the last second of its journey, where x is the distance covered in the first second. How much time does it take to reach the ground.
View SolutionFrom a high tower, at time t=0, one stone is dropped from rest and simultaneously another stone is projected vertically up with an initial velocity .The graph of distance S between the two stones plotted against time t will be
View SolutionA ball is dropped from top of a tower 250 m high. At the same time, another ball is thrown upwards with a velocity of 50ms−1 from the ground. The time at which they cross each other is
View Solution

