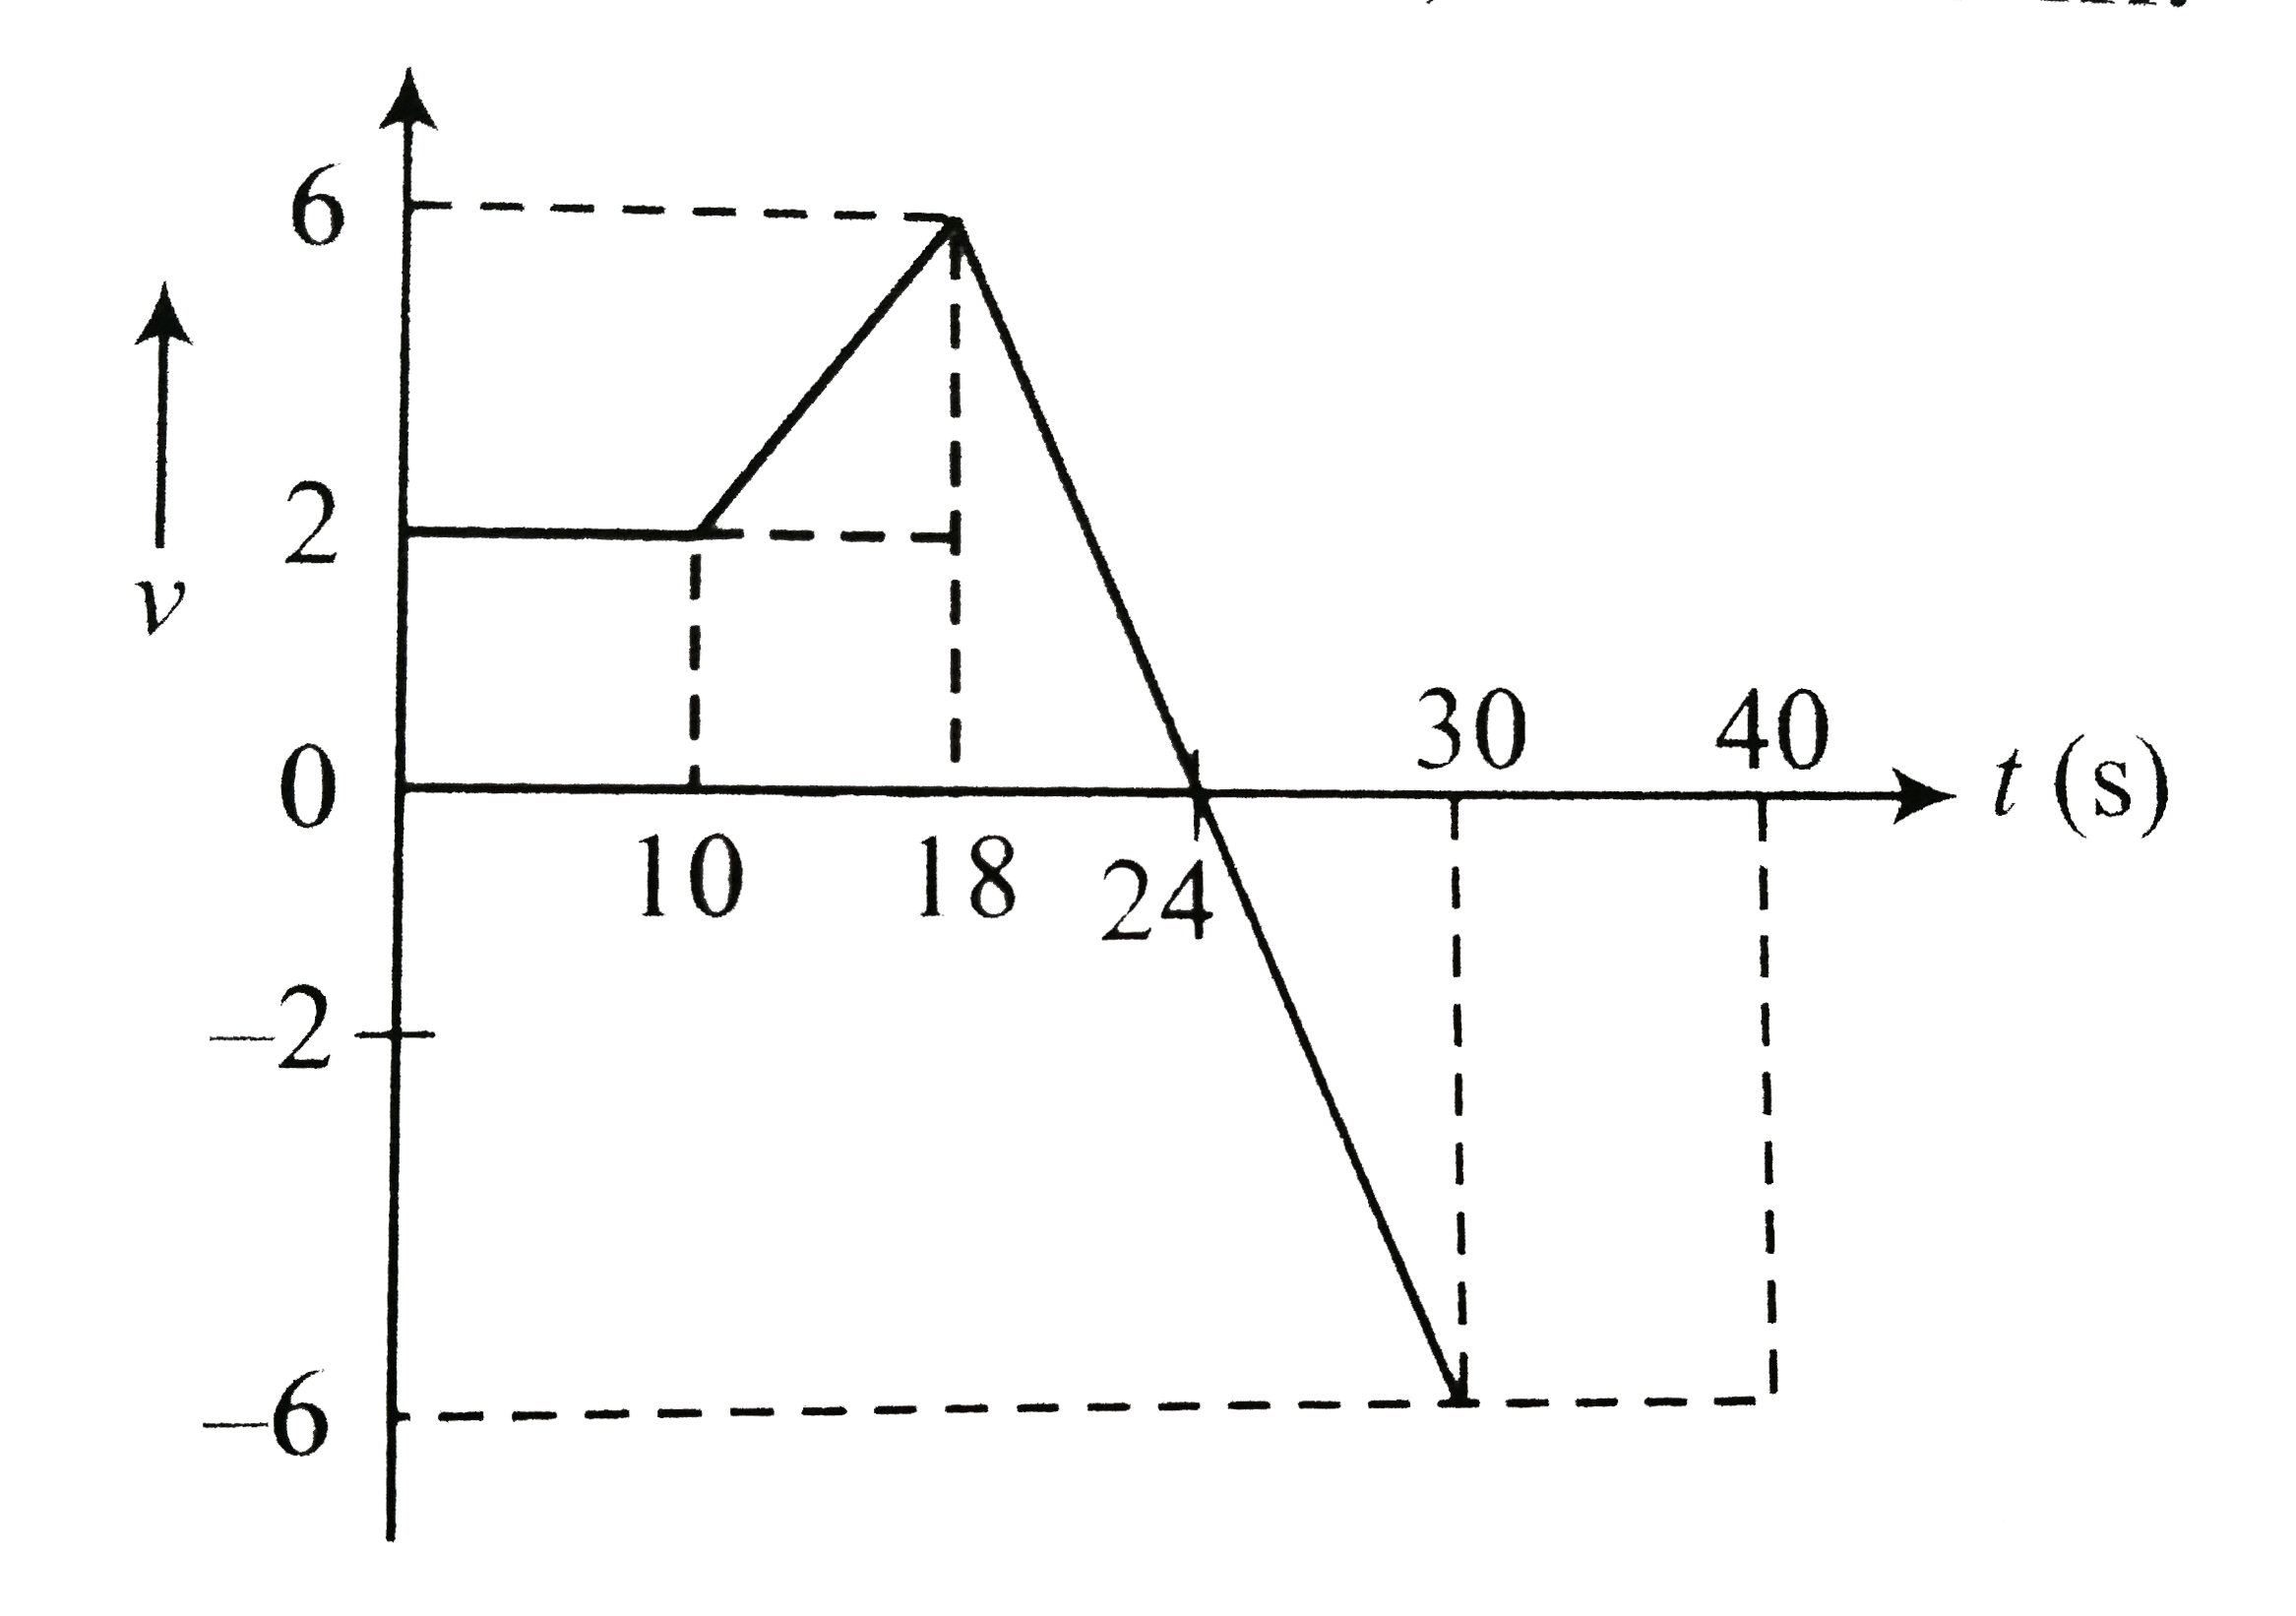
A particle moves in a straight line with the velcity as shown in. At t=0,x=16m,
 .
.
The maximum value of theposition coordinate of the particle is 54m.
The maximum value of theposition coordinate of the particle is 36m.
The particle is at the position of 36m at t=18s.
The particle is at the position of 36m at t=30s.
The correct Answer is:A, C, D
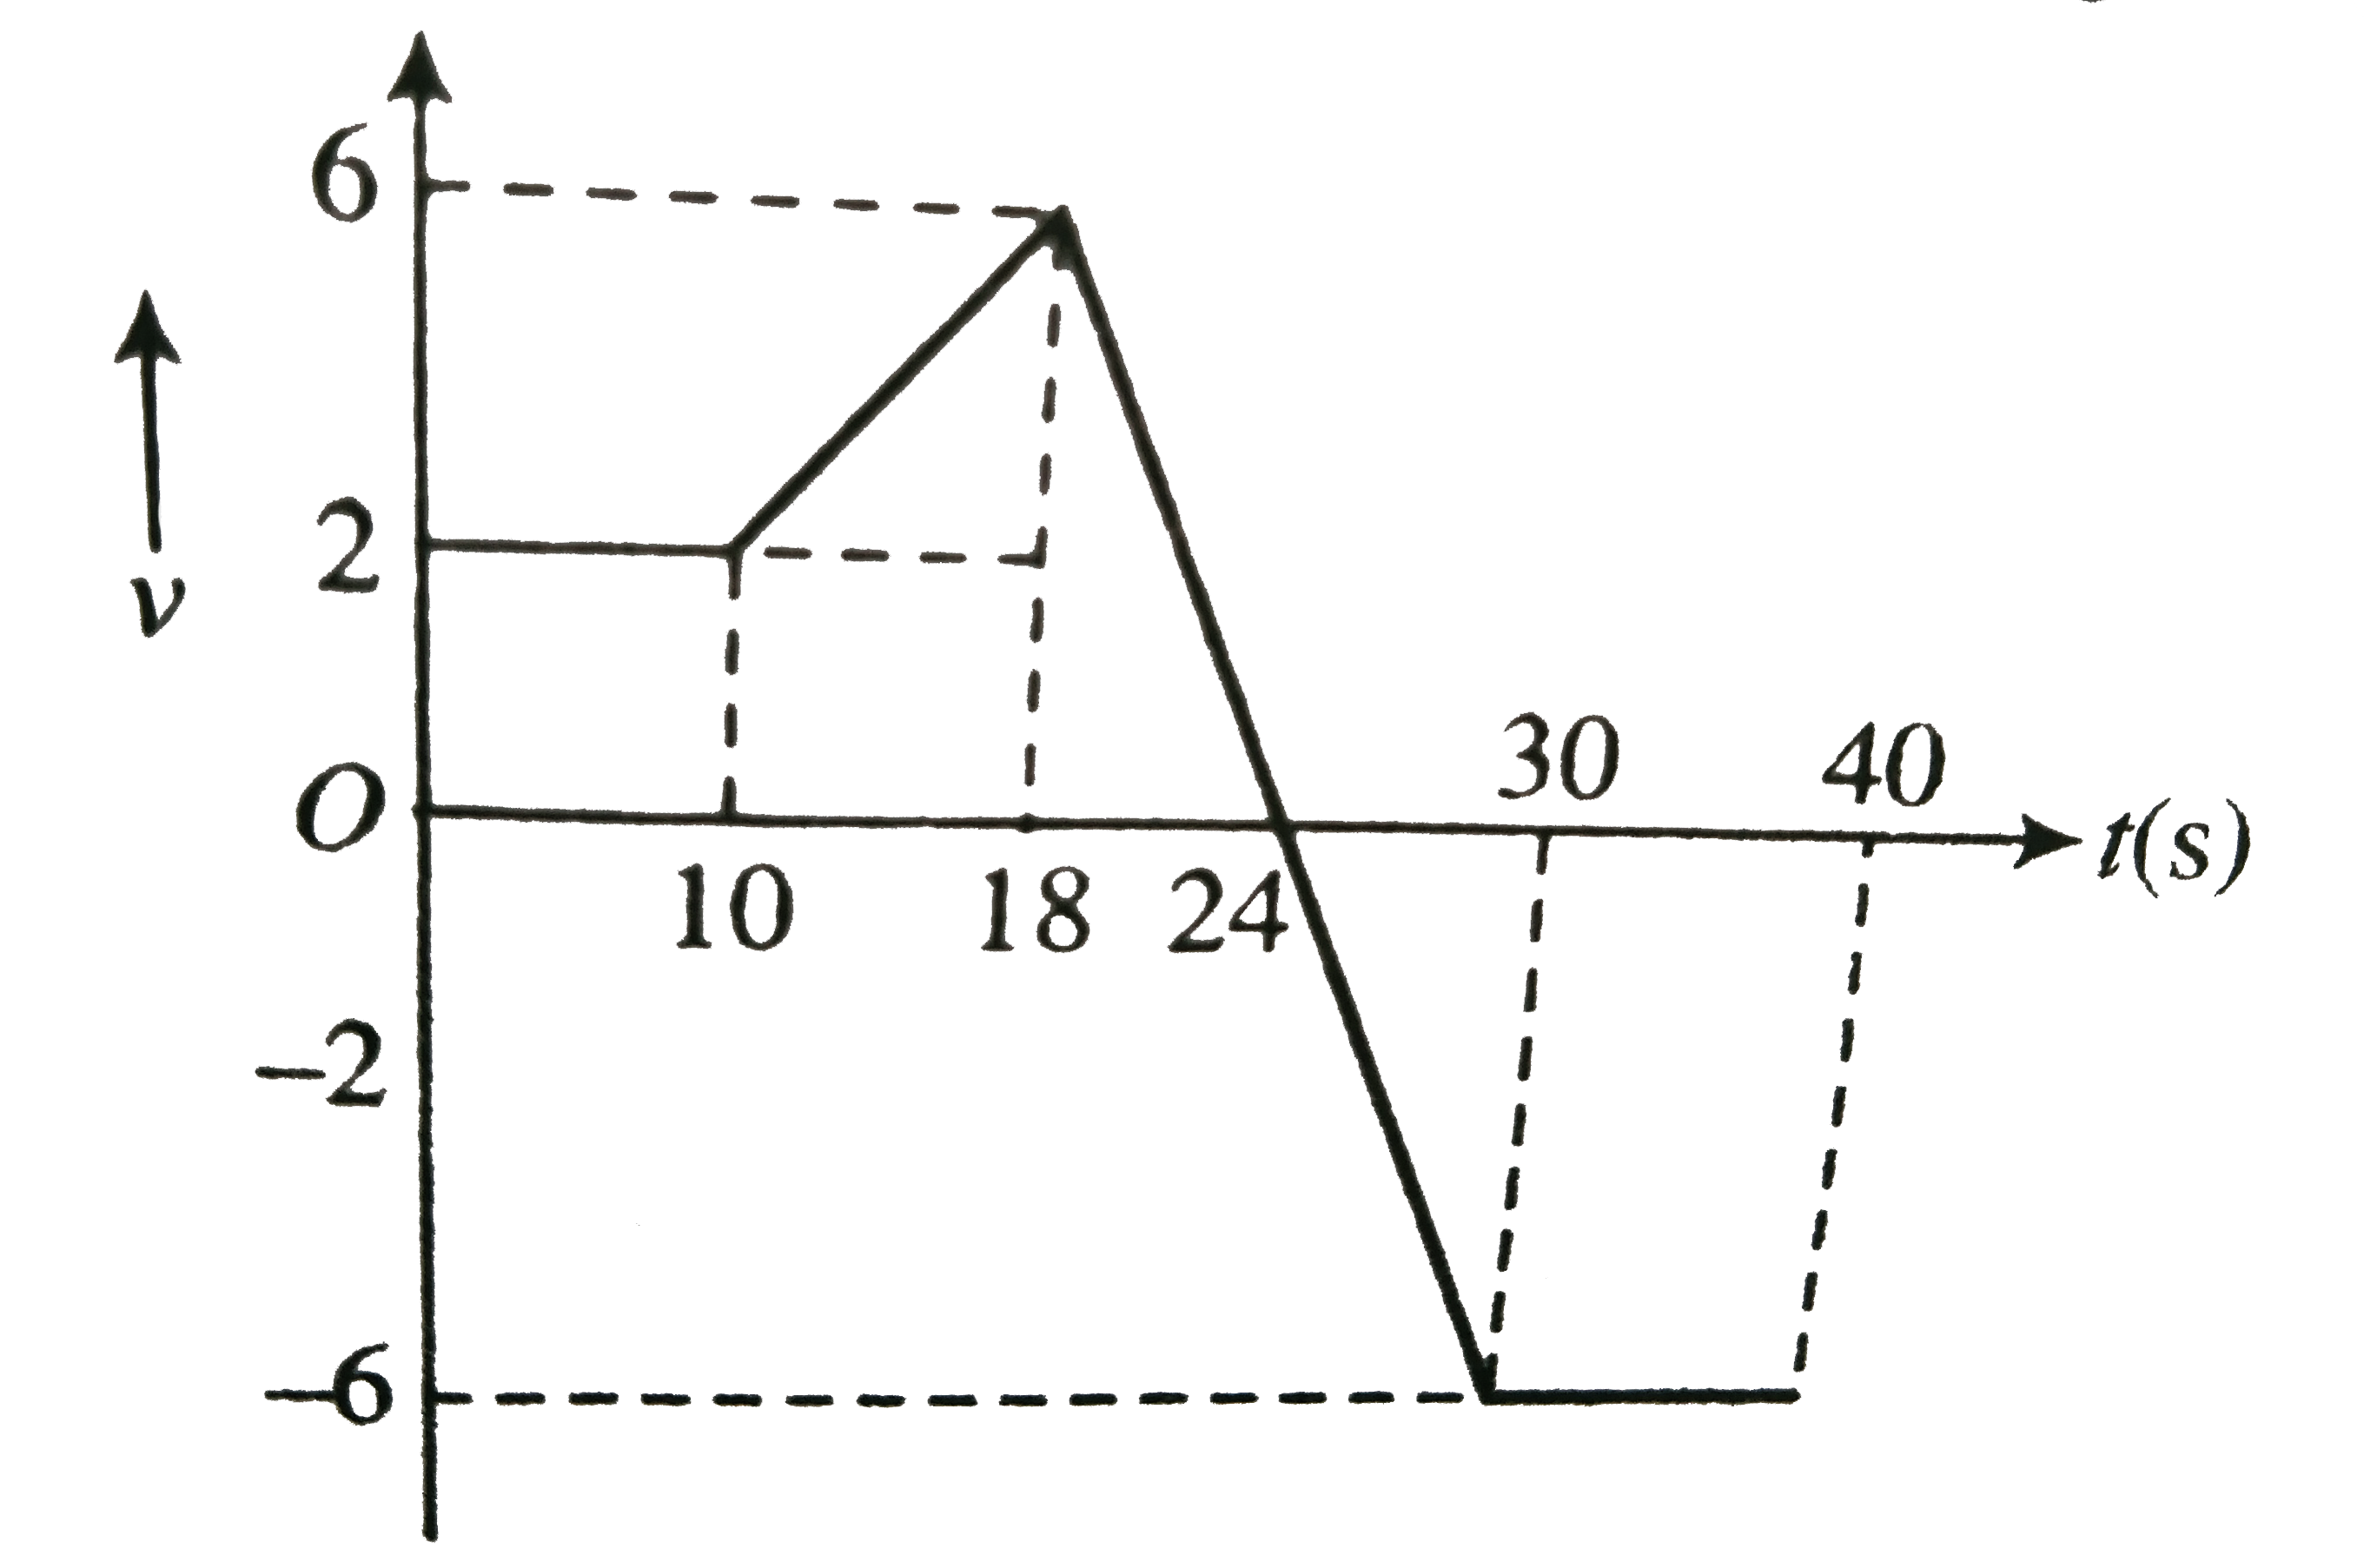
Maximum value of position coordinate=Initial coordinate+Area under the graph up to t=24 a As up to t=24s. The displacement of the particle will be possitive Fig.
 .
.
Maximum value of position coordinate
=−16+[(2×10)+(2+62)×(18−10)+1×62×(24−18)]
=−16+[20+32+18]=54m
At time t=18s
Position =−16+ Area of graph up to t=18s
=−16+[20+32=18]=54m
At time t=30s.
Position =−16+Area of graph up to t=30s
=−16+[70−12×6×6]=36m.
Topper's Solved these Questions
- BOOK - CENGAGE PHYSICS ENGLISHCHAPTER - KINEMATICS-1EXERCISE - Assertion-reasoning5videos
KINEMATICS-1
- BOOK - CENGAGE PHYSICS ENGLISHCHAPTER - KINEMATICS-1EXERCISE - Linked Comprehension30videos
KINEMATICS-1
- BOOK - CENGAGE PHYSICS ENGLISHCHAPTER - KINEMATICS-1EXERCISE - Graphical cancept1videos
KINEMATICS-1
- BOOK - CENGAGE PHYSICS ENGLISHCHAPTER - GRAVITATIONEXERCISE - INTEGER_TYPE1videos
GRAVITATION
- BOOK - CENGAGE PHYSICS ENGLISHCHAPTER - KINEMATICS-2EXERCISE - Exercise Integer9videos
KINEMATICS-2
Similar Questions
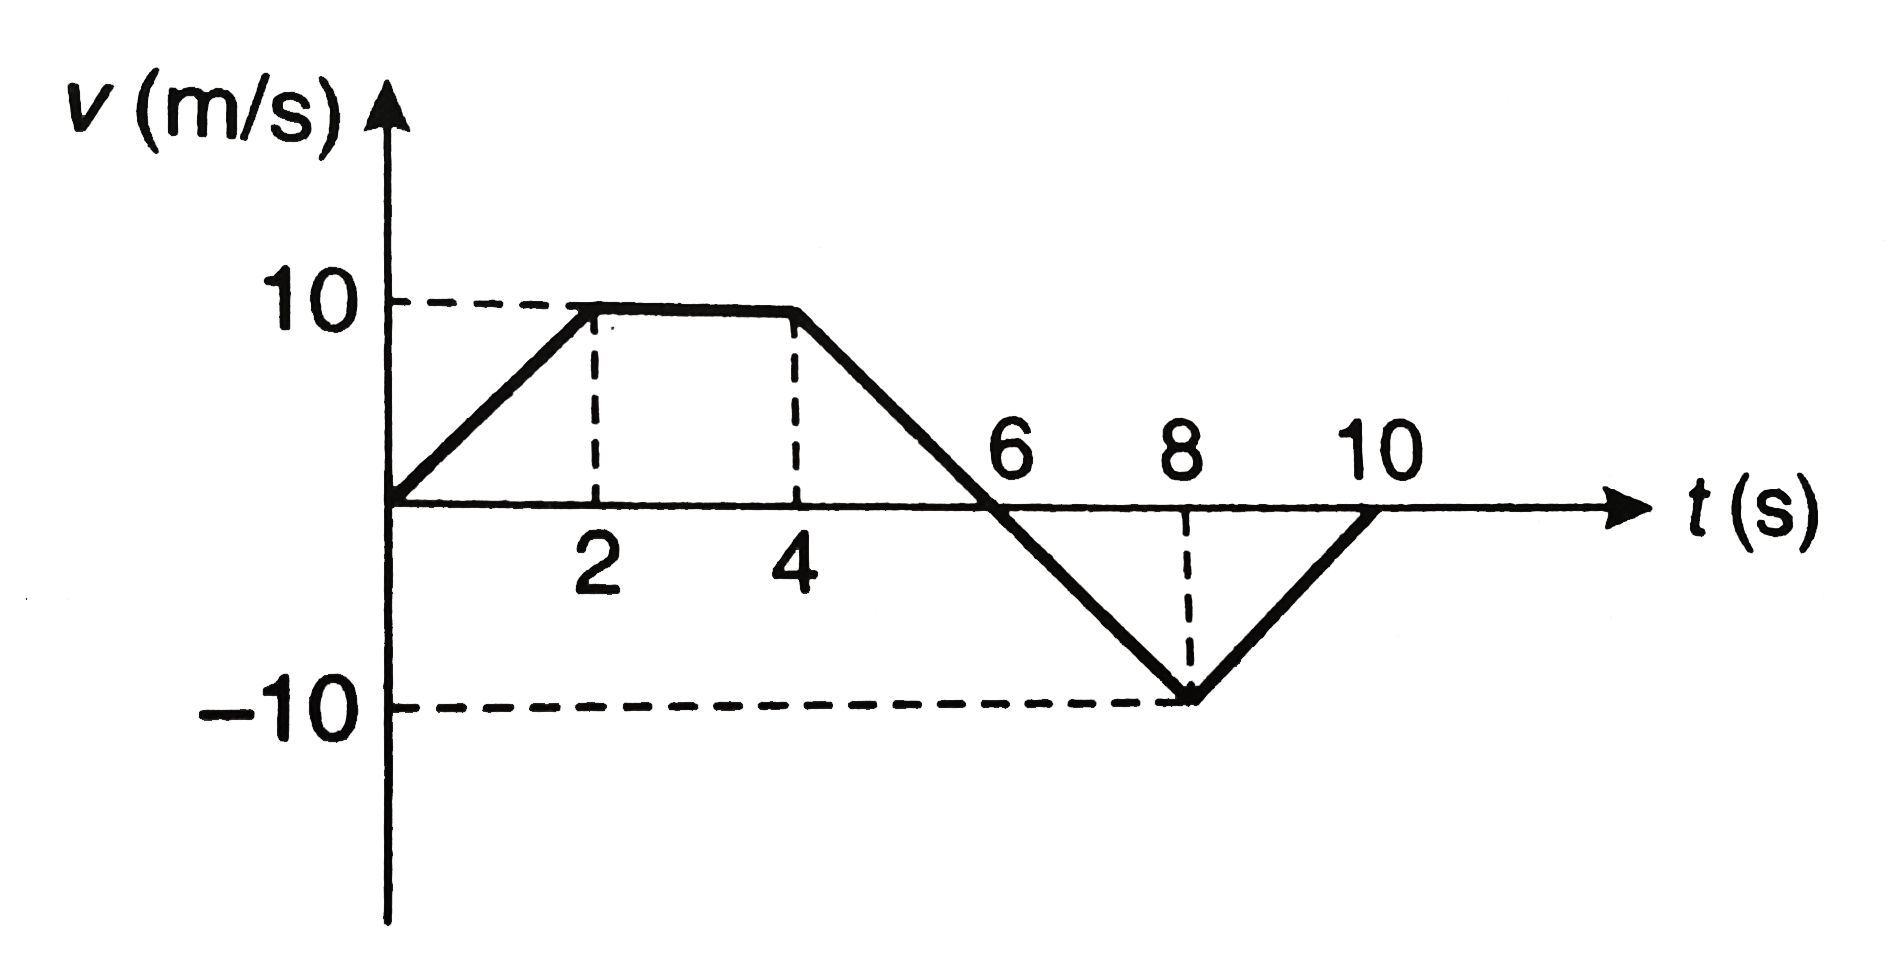
Velocity-time graph of a particle moving in a straight line is shown in figure. At time t=0,s=−10m. Plot corresponding a-t and s-t graphs.
 View Solution
Velocity displacement graph of a particle moving in a straight line is as shown in figure.
 View Solution
A particle starting from rest moves in a straight line with acceleration as shown in the a-t graph. Find the distance (in m) travelled by the particle in the first four seconds from start of its motion.
Q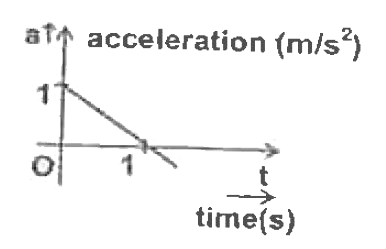 View Solution
velocity-time graph of a particle moving in a straight line is as shown in figure. At time t=0, velocity of the particle is zero. Find
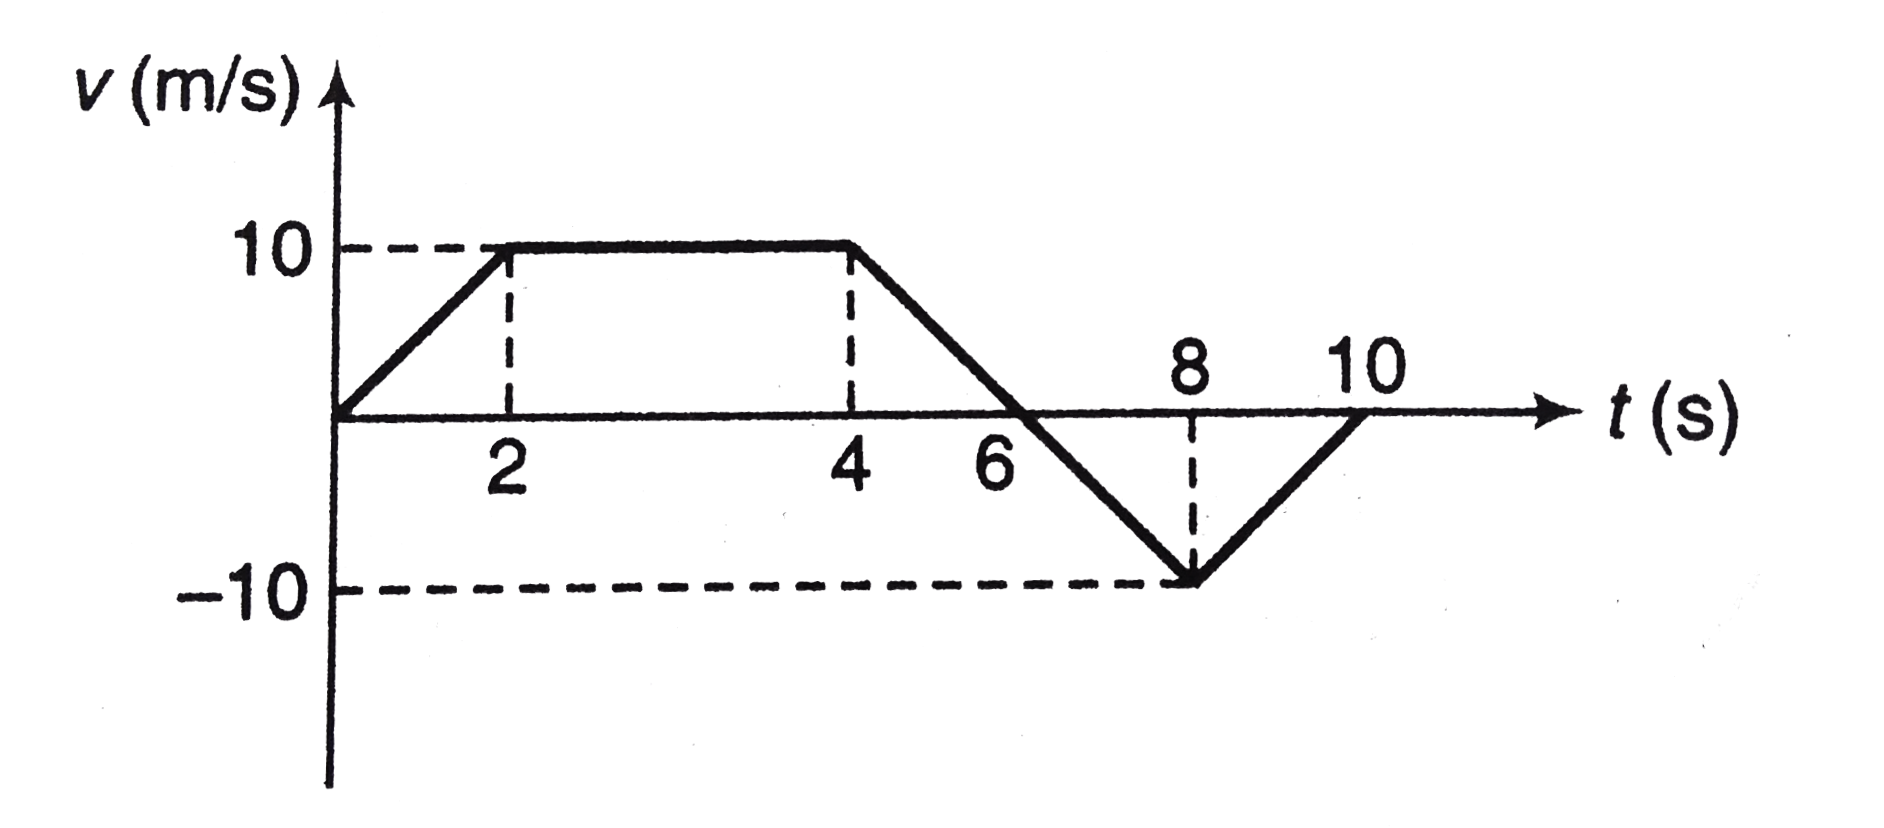
(a) average acceleration in a time interval from t=6s to t=12s,
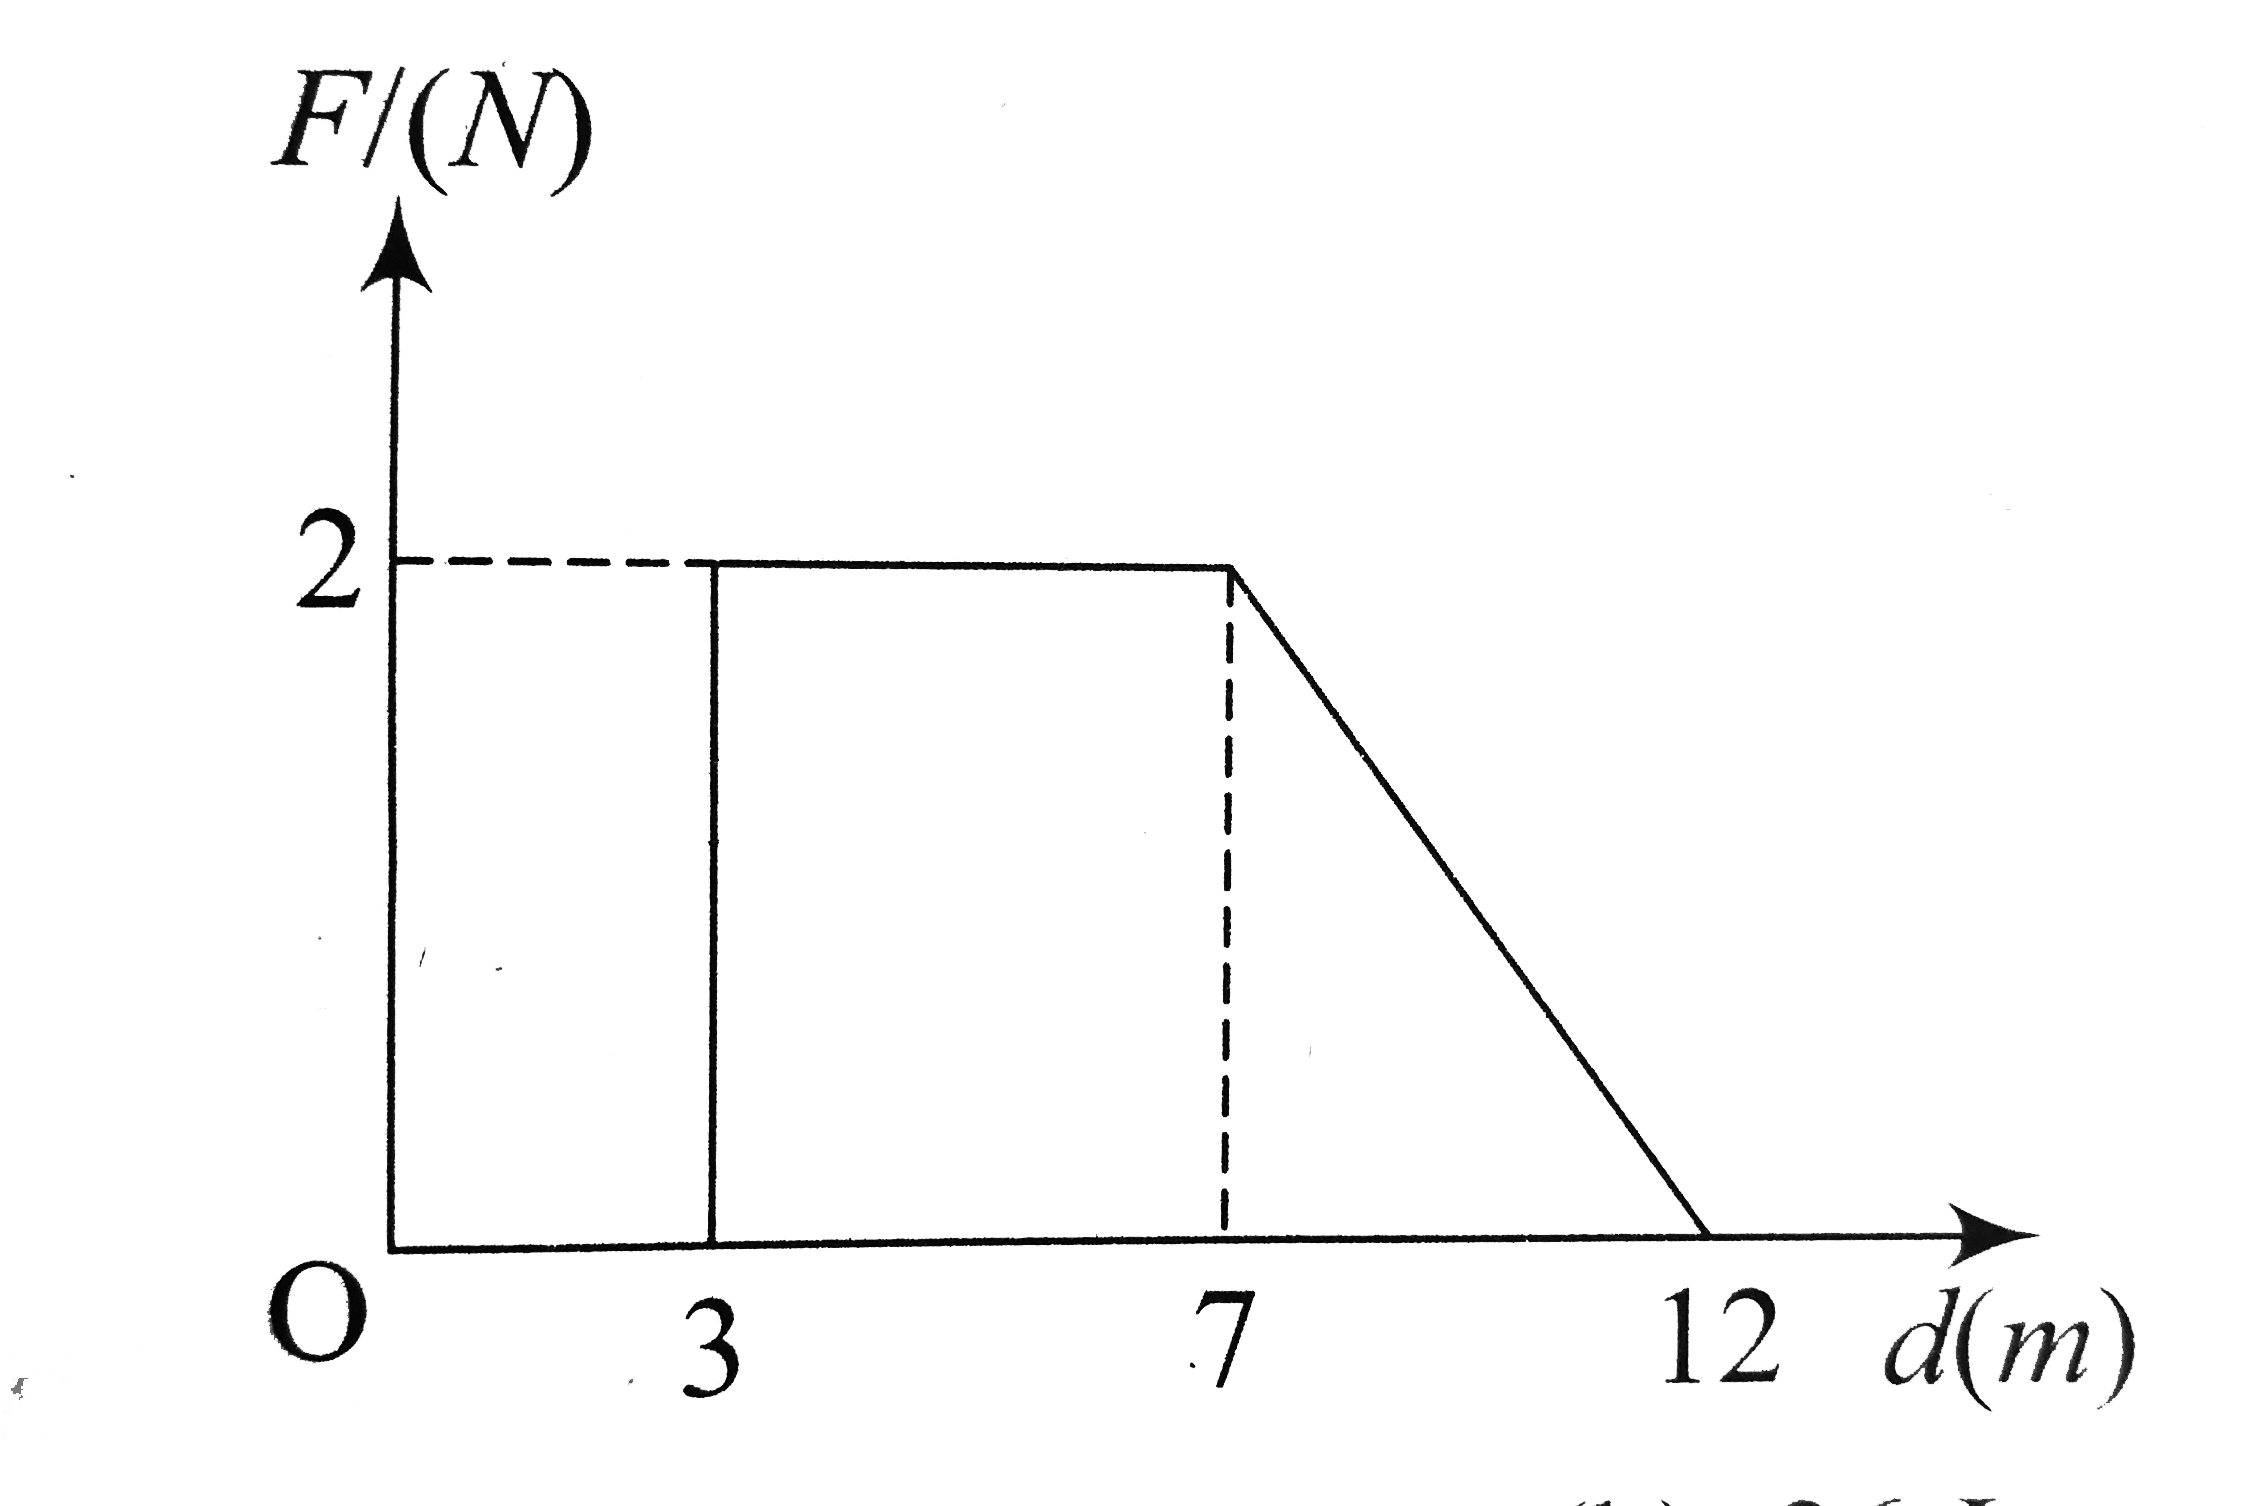
(b) velocity of the particle at t=14s.View SolutionForce F on a particle moving in a straight line varies with distance d as shown in the figure. The work done on the particle during its displacement of 12m is
 View Solution
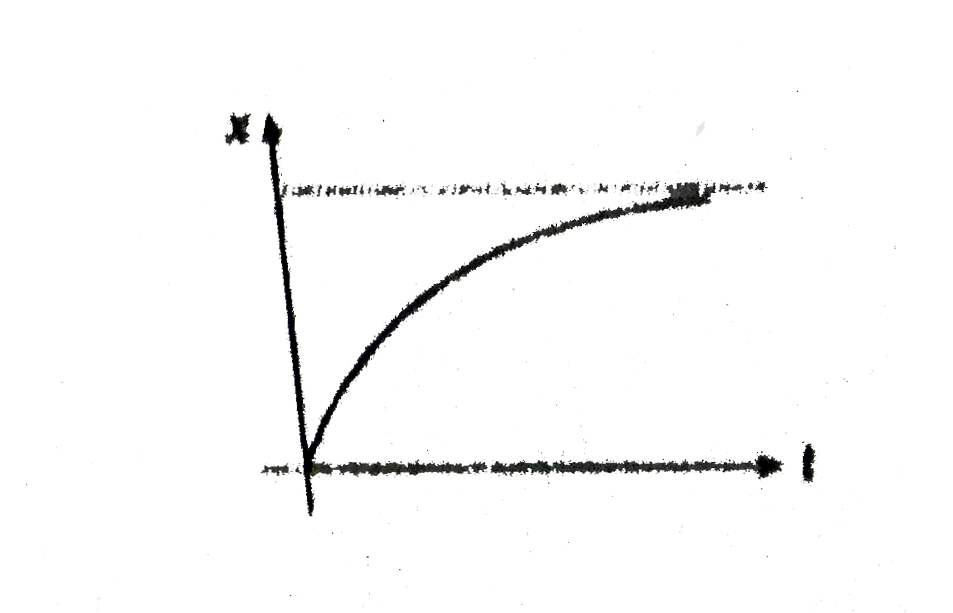
Variation of displacement x of a particle moving on a straight line with time t is shown in following figure. The figure indicates :
 View Solution
Variation of displacement x of a particle moving on a straight line with time t is shown in following figure. The figure indicates :
 View Solution
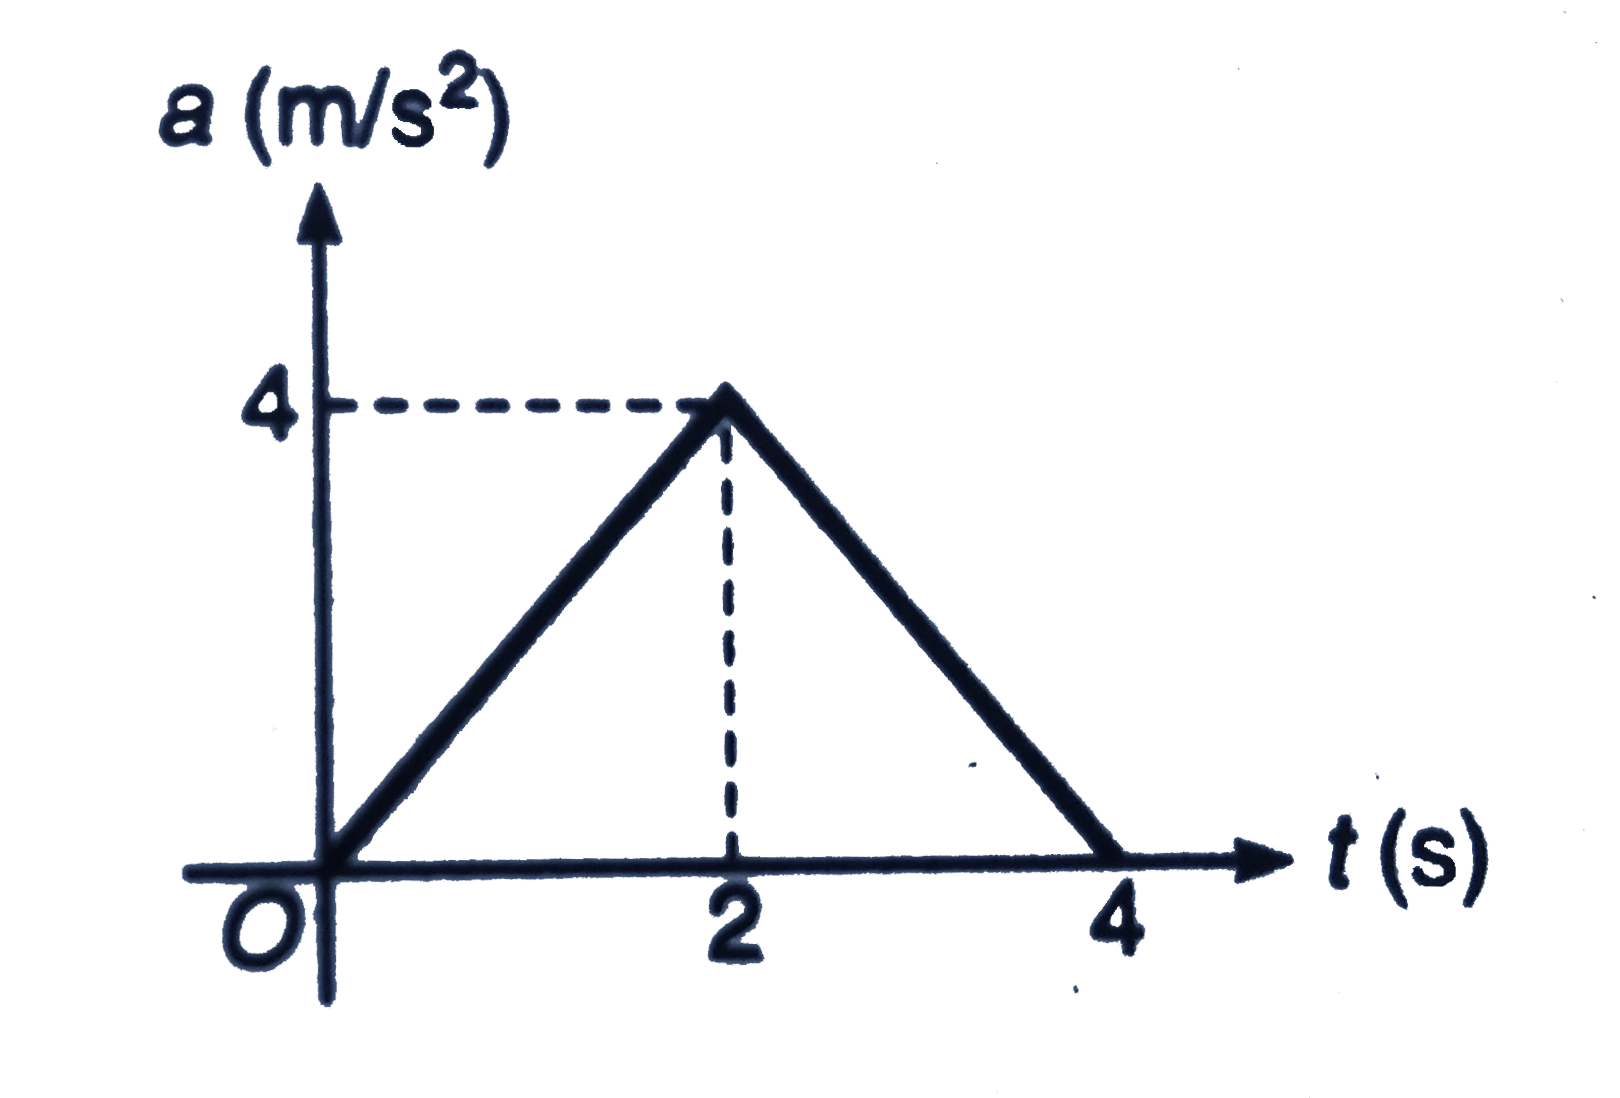
Accleration-time graph of a particle moving in a straight line is as shown in Fig. Velocity of particle at time t=0 is 2m/s. Find the velocity at the end of fourth second.
 View Solution
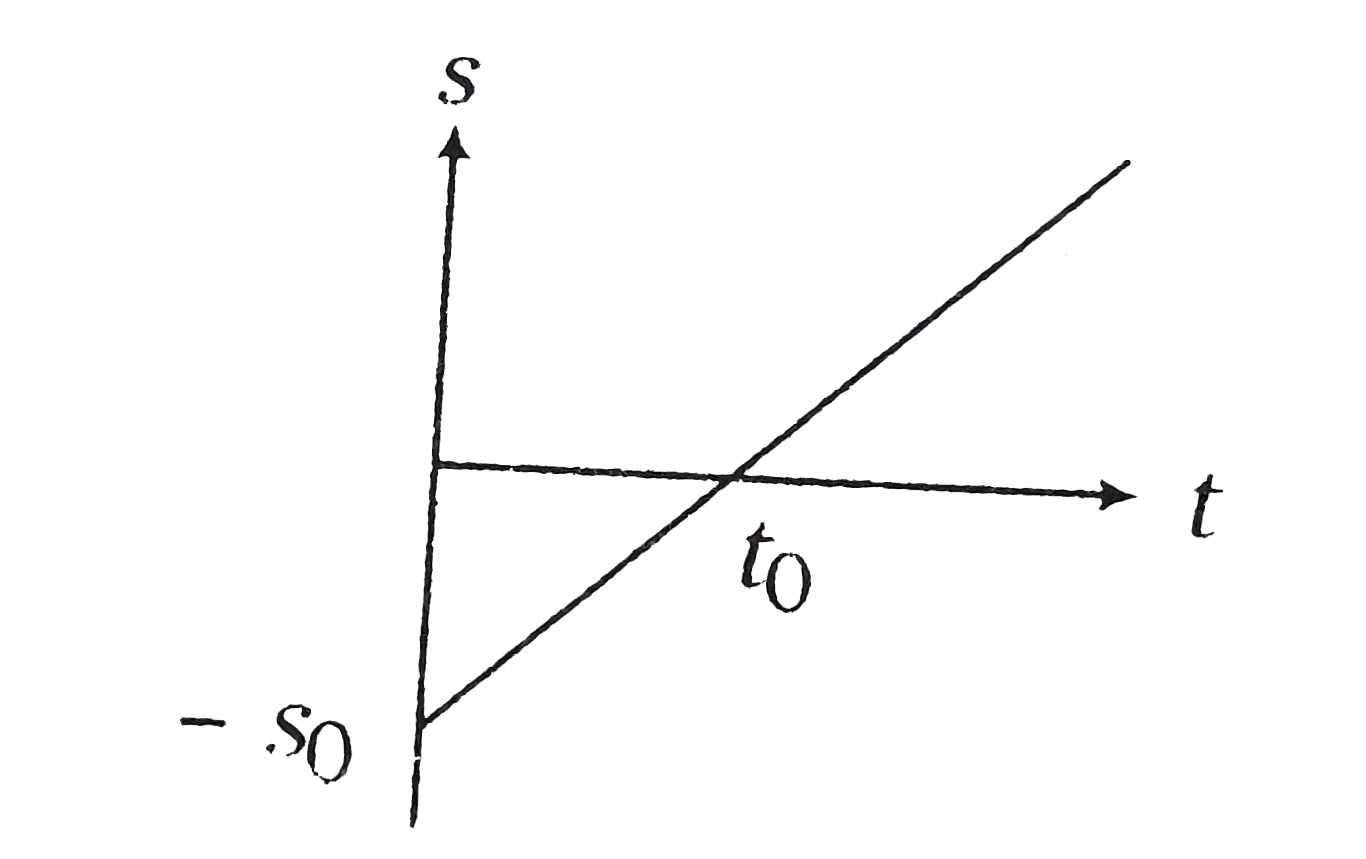
Displacement - time graph of particle moving in a straight line is as shown in figure. State whether the motion is accelerated or not. Describe the motion in detail. Given,
s0=20m and t0=4s.
 View Solution
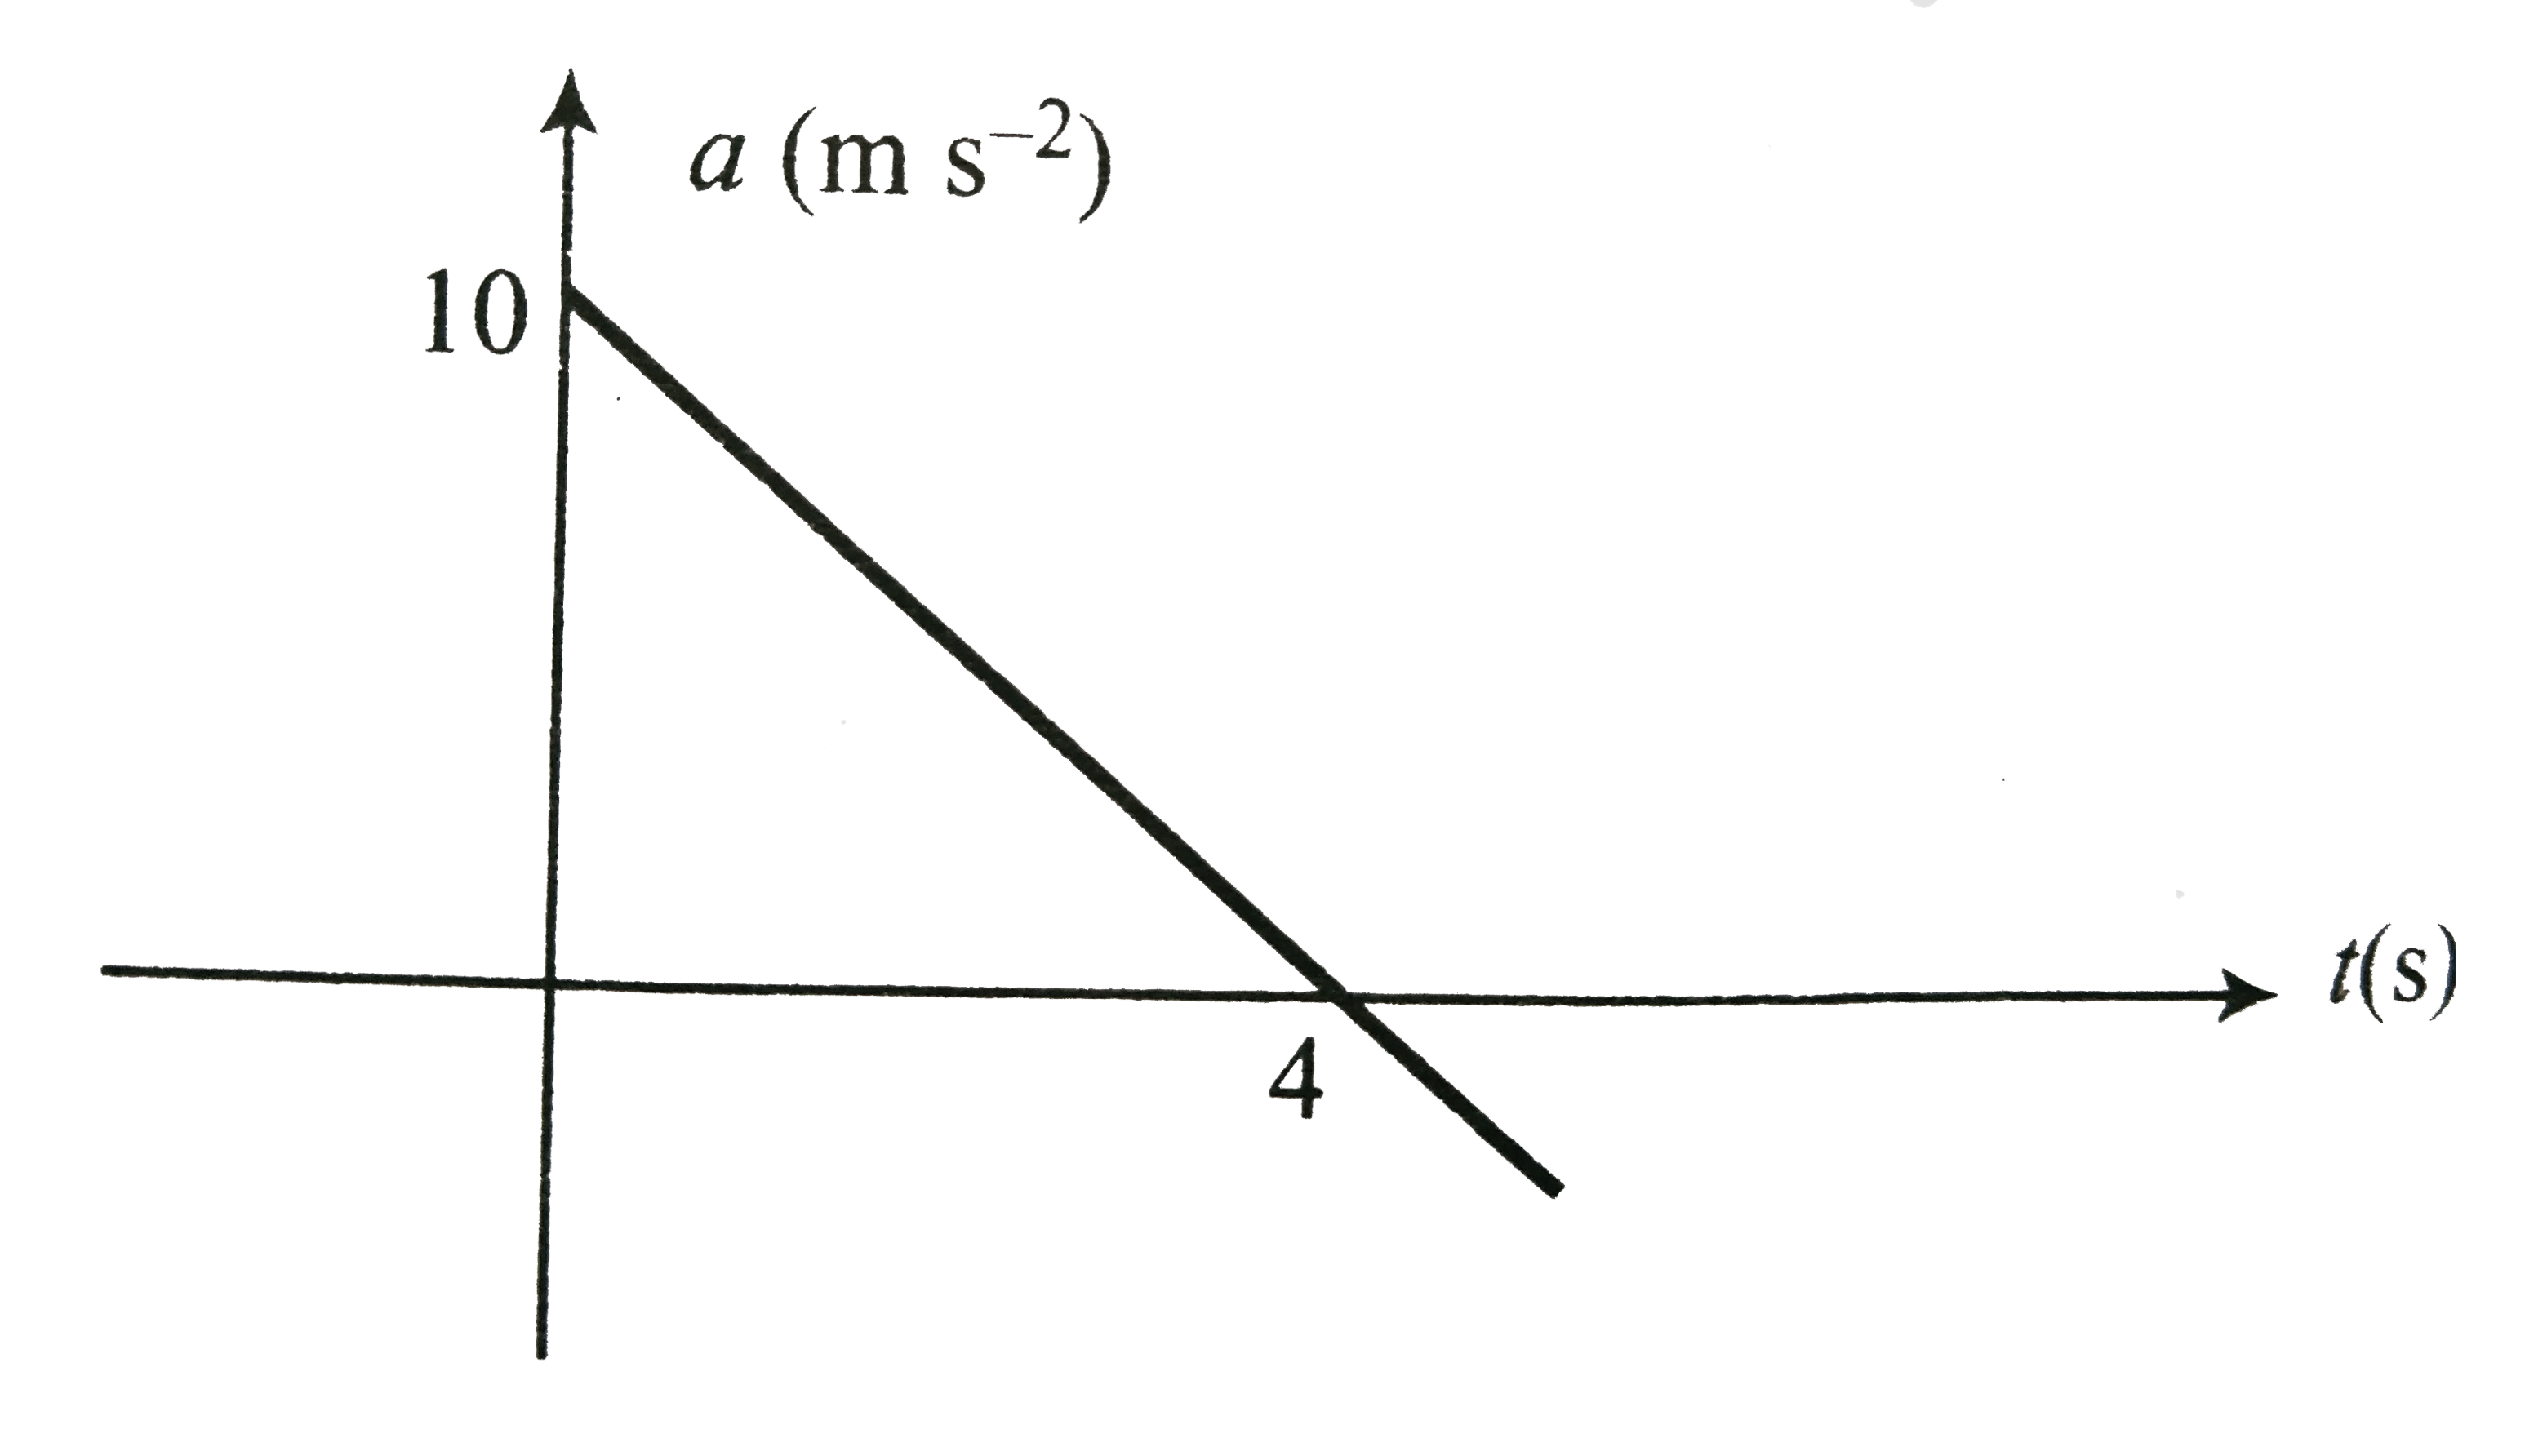
The acceleration-time graph of a particle moving along a straight line is as shown in. At what time the particle acquires its initial velocity?
 .View Solution

