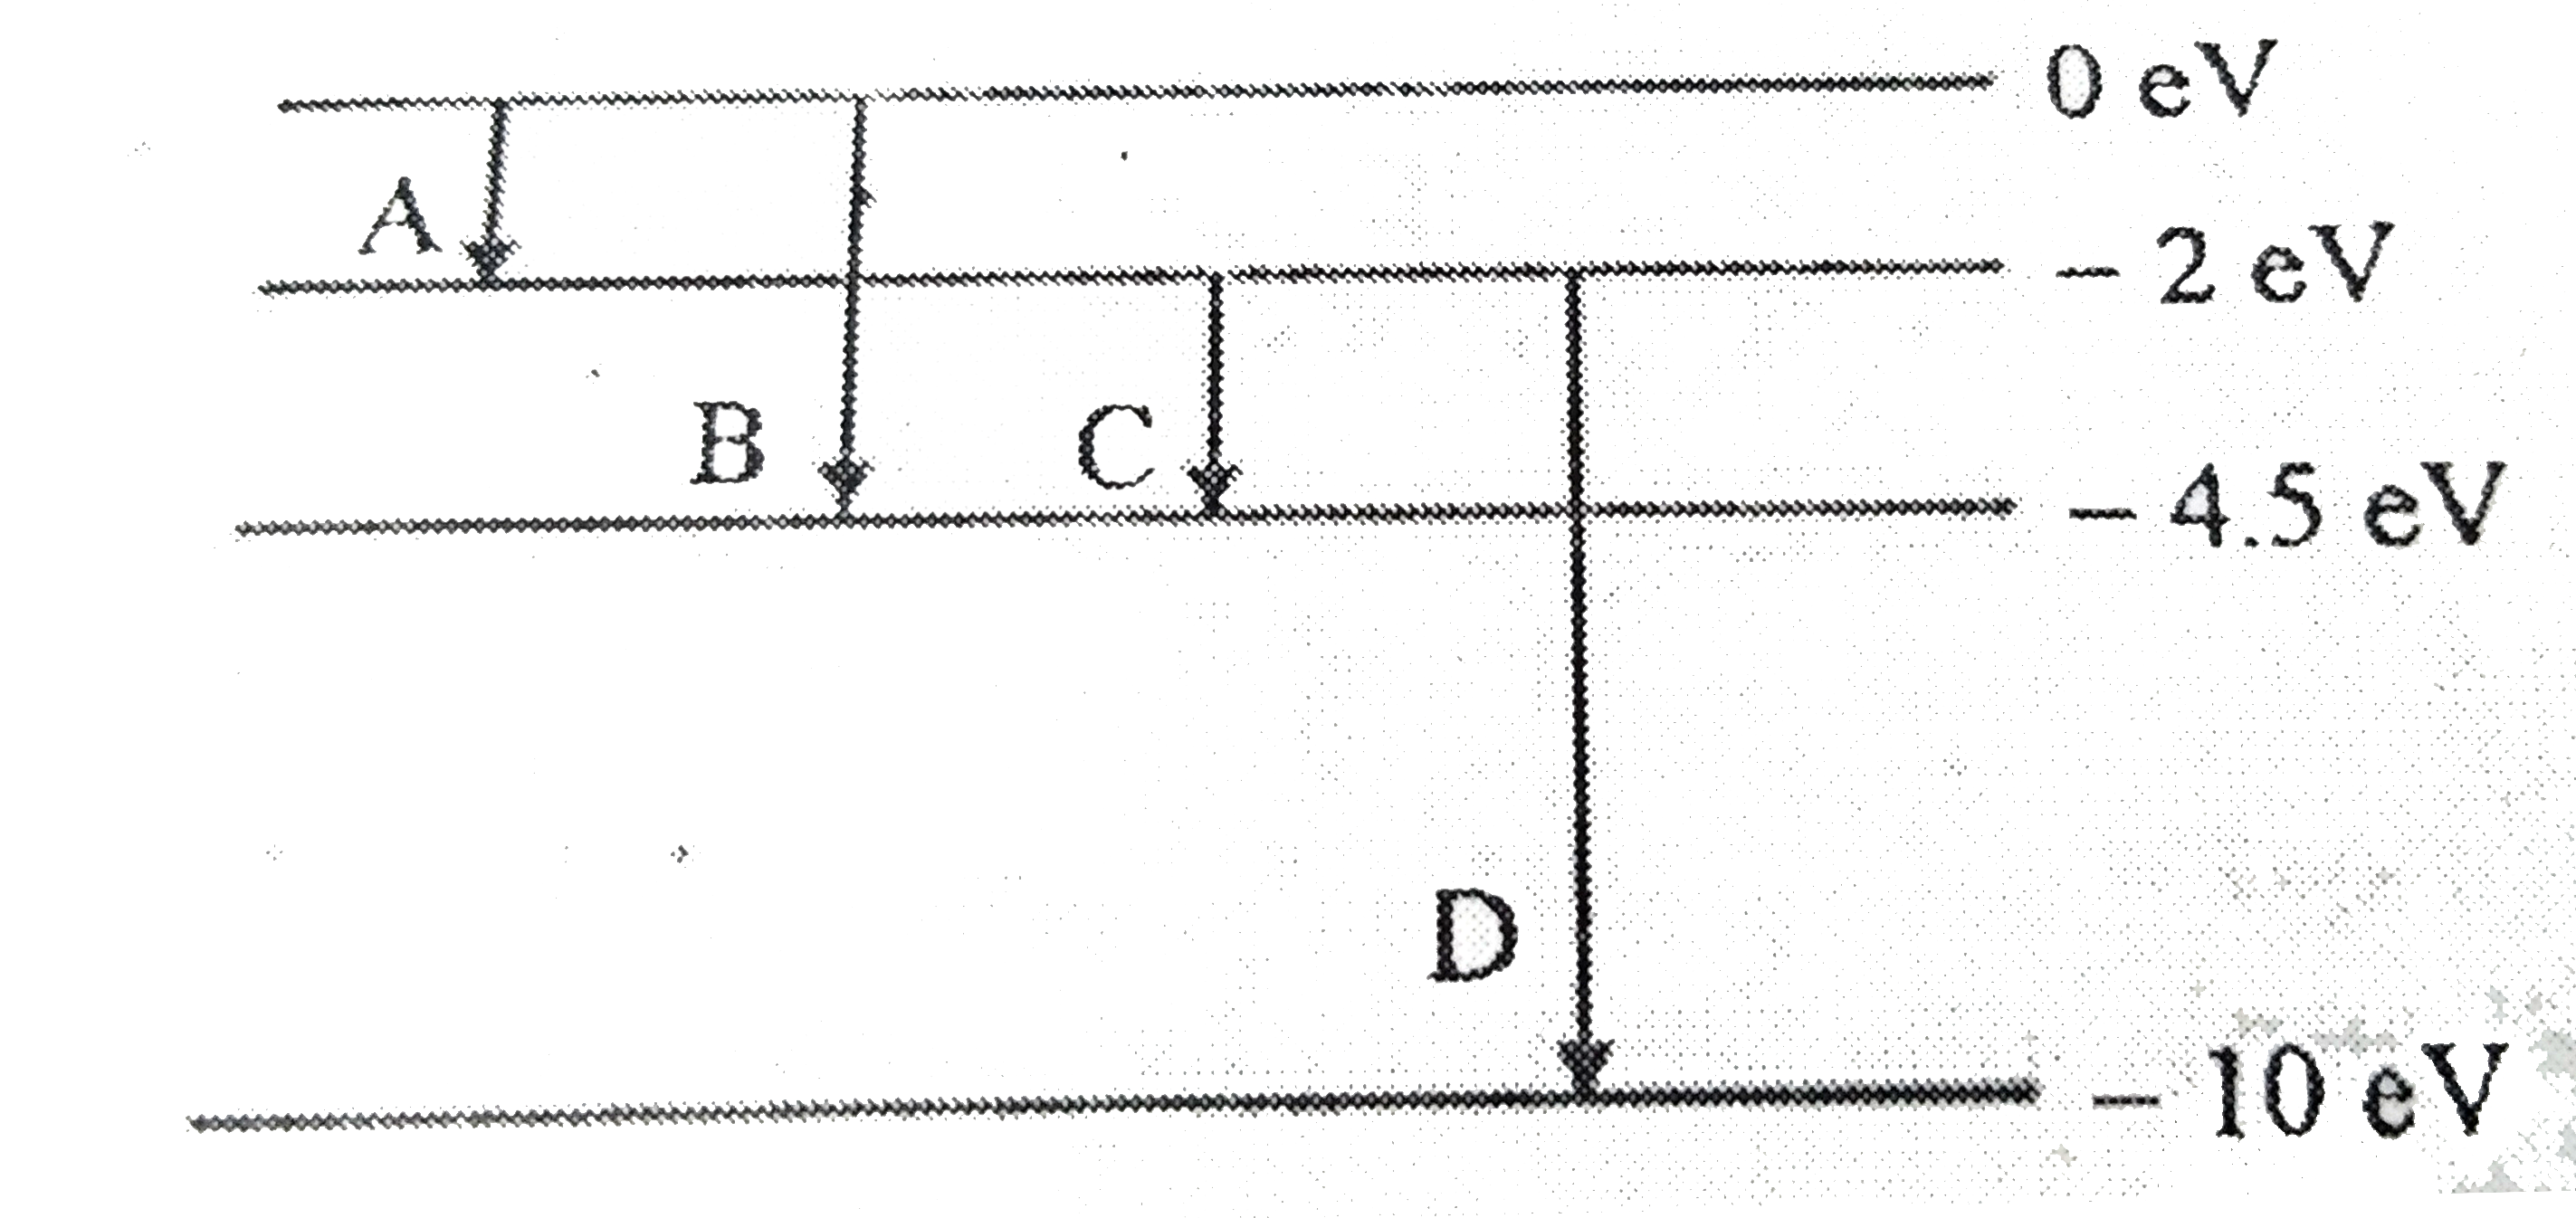
Figure shown five energy levels of an atom , one being much lower than the other four. Five transitios between the levels are idicated, each of which produces a photon of definite energy and frequency.
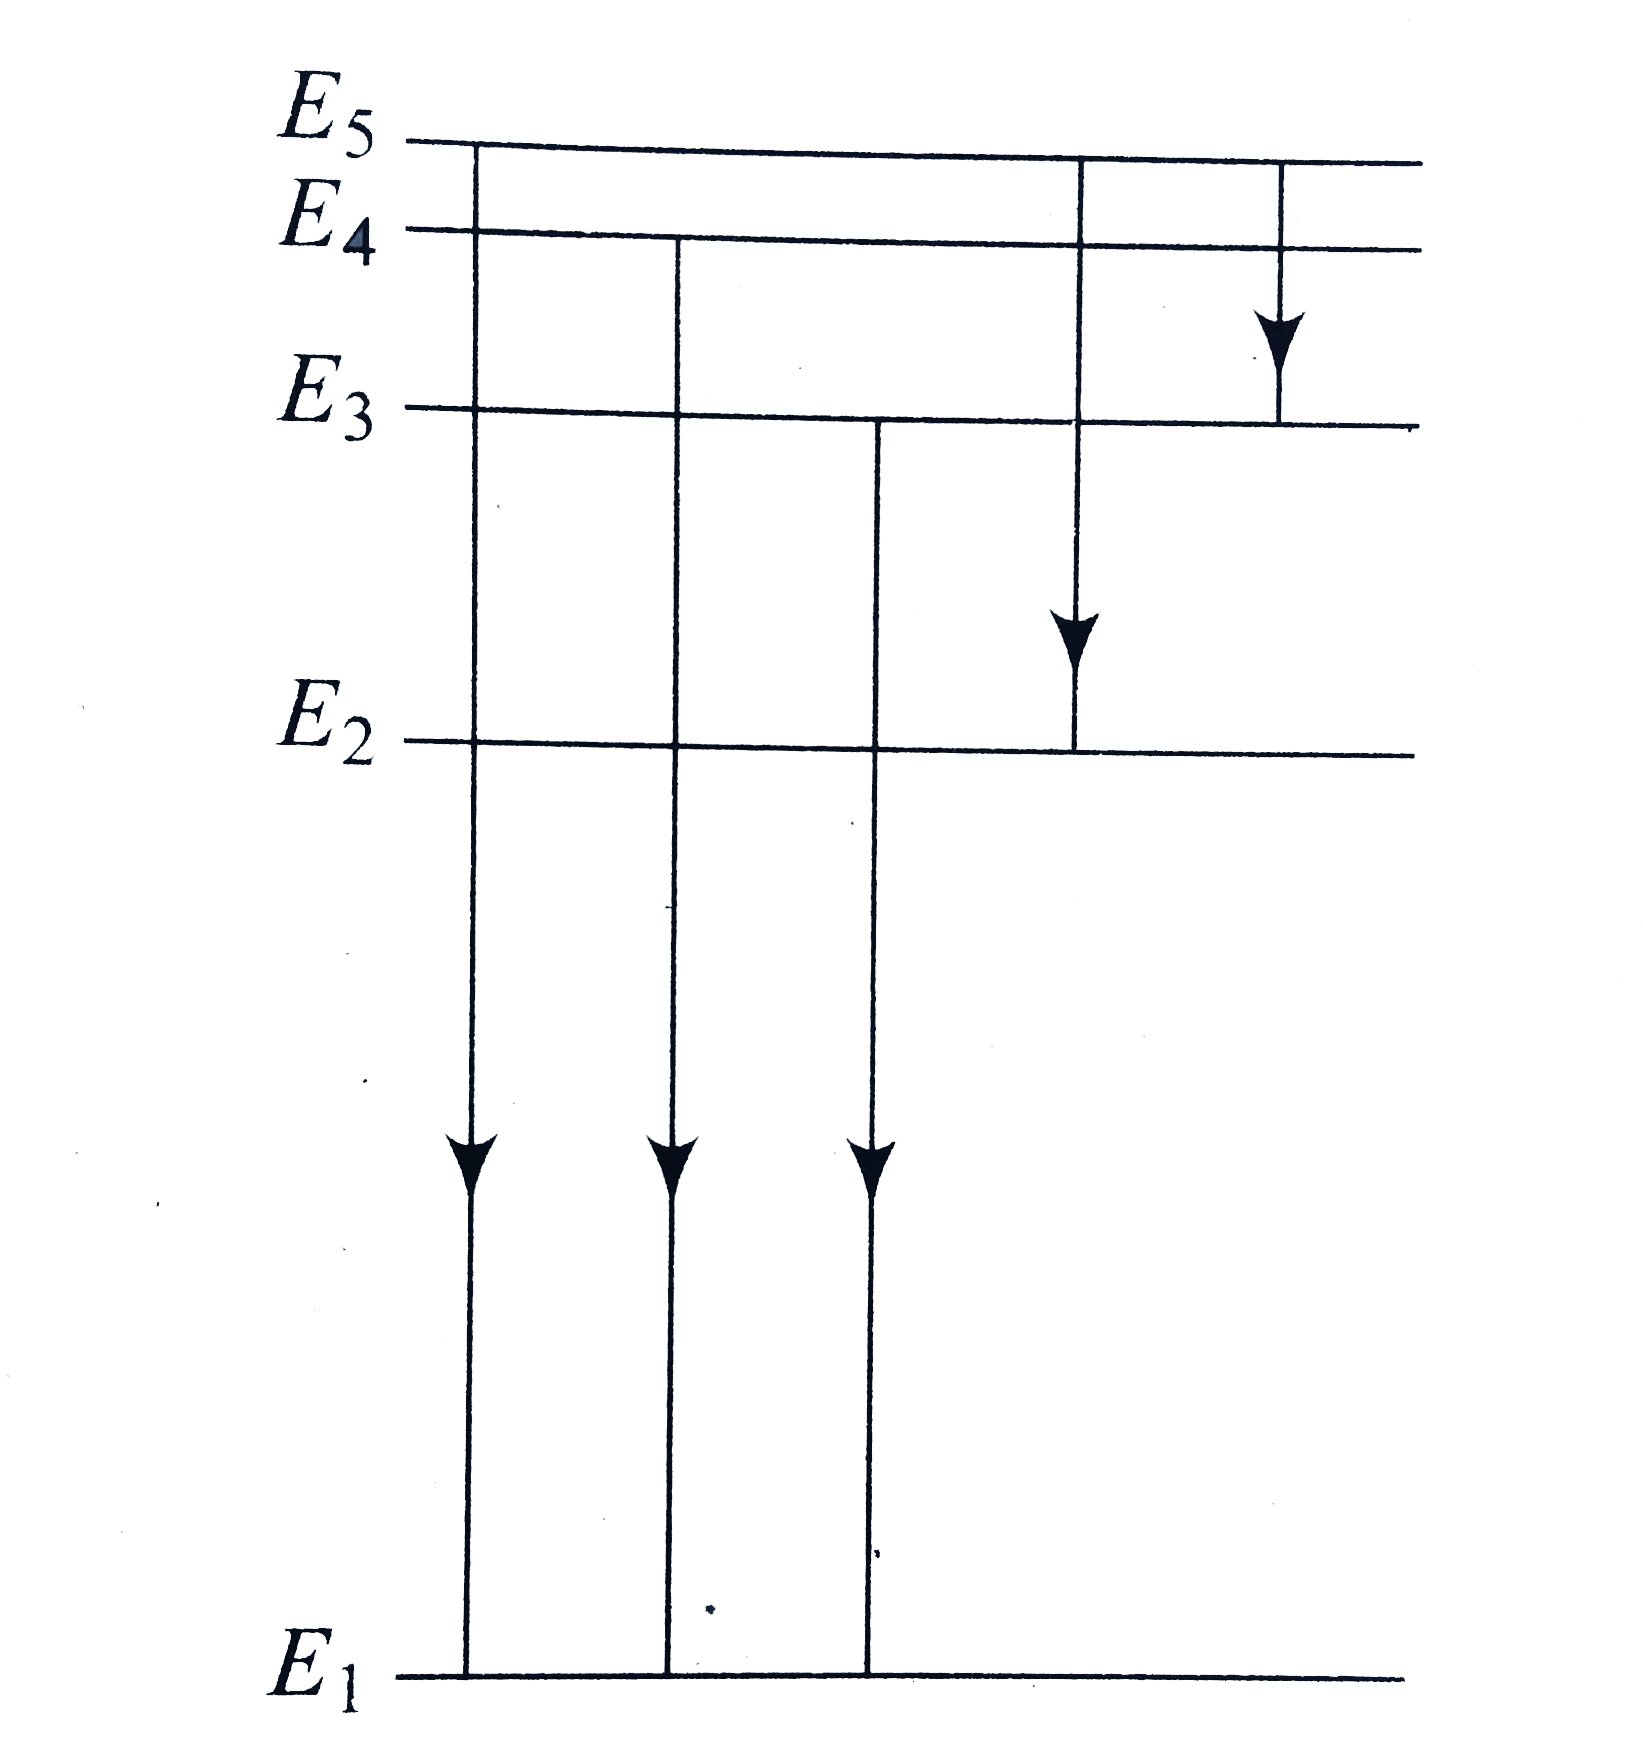 Which one of the spectrum below best corresponding to the set of transition indicated?


The correct Answer is:D
The first three transition from the left fall in the Lyman series of the hydrogen spectrum which corresponds to ultraviolet radiation.
The fourth transion fall in the Balmer series of the spectrum which corresponds to the visible light emission .
Thus, frequencies of the last two transition are closed to each other on the extreme left of the frequencies spectrum whereas the frequencies of the first three transition are closer to one another and fall on the right corner of the frequencies spectrum. The spectrum of the transition is thus best represented in diagram
Topper's Solved these Questions
- ATOMIC PHYSICSBOOK - CENGAGE PHYSICS ENGLISHCHAPTER - ATOMIC PHYSICSEXERCISE - Multiple Correct
13 Videos
- ATOMIC PHYSICSBOOK - CENGAGE PHYSICS ENGLISHCHAPTER - ATOMIC PHYSICSEXERCISE - Linked Comprehension
62 Videos
- ATOMIC PHYSICSBOOK - CENGAGE PHYSICS ENGLISHCHAPTER - ATOMIC PHYSICSEXERCISE - Subject
17 Videos
- ALTERNATING CURRENTBOOK - CENGAGE PHYSICS ENGLISHCHAPTER - ALTERNATING CURRENTEXERCISE - Single Correct
10 Videos
- CAPACITOR AND CAPACITANCEBOOK - CENGAGE PHYSICS ENGLISHCHAPTER - CAPACITOR AND CAPACITANCEEXERCISE - Integer
5 Videos
Similar Questions
The energy levels of an atom are as shown in figure . Which one of those transition will result in the emission of a photon of wavelength 275nm?
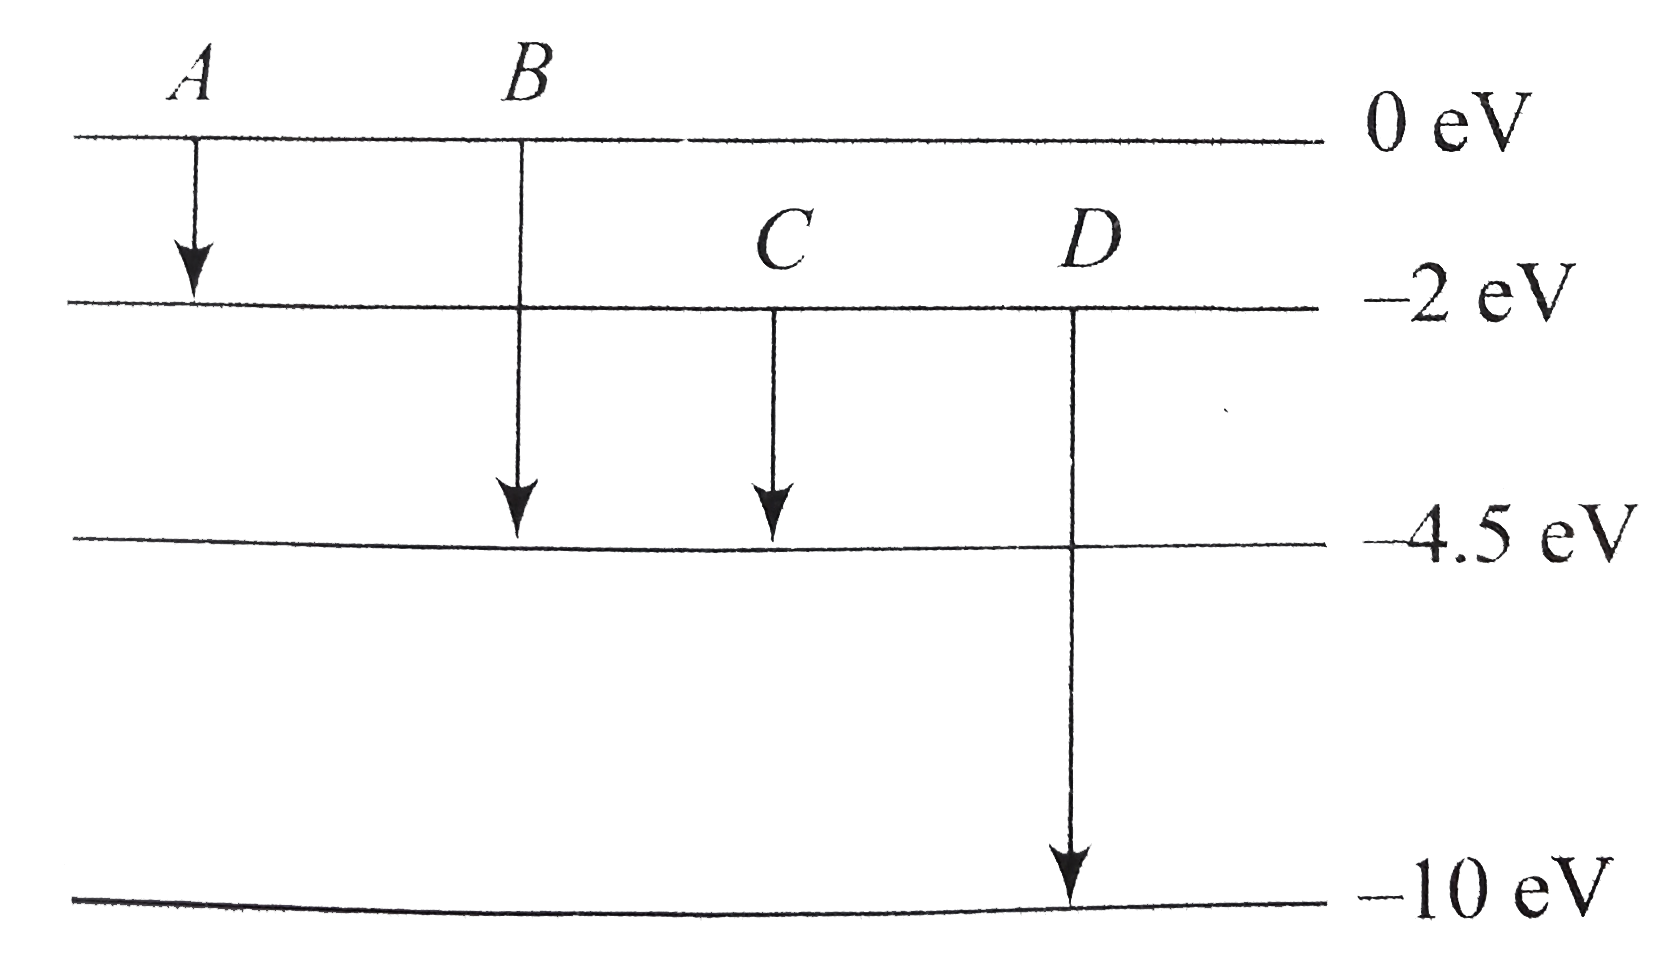
View SolutionShows the energy levels for an electron in a certain atom. Which transition shown represented the emission of a photon with the most energy?
View Solution
Knowledge Check
The diagram shows the energy levels for an electron in a certain atom. Which transition shown represents the emission of photon with the most enegy ?
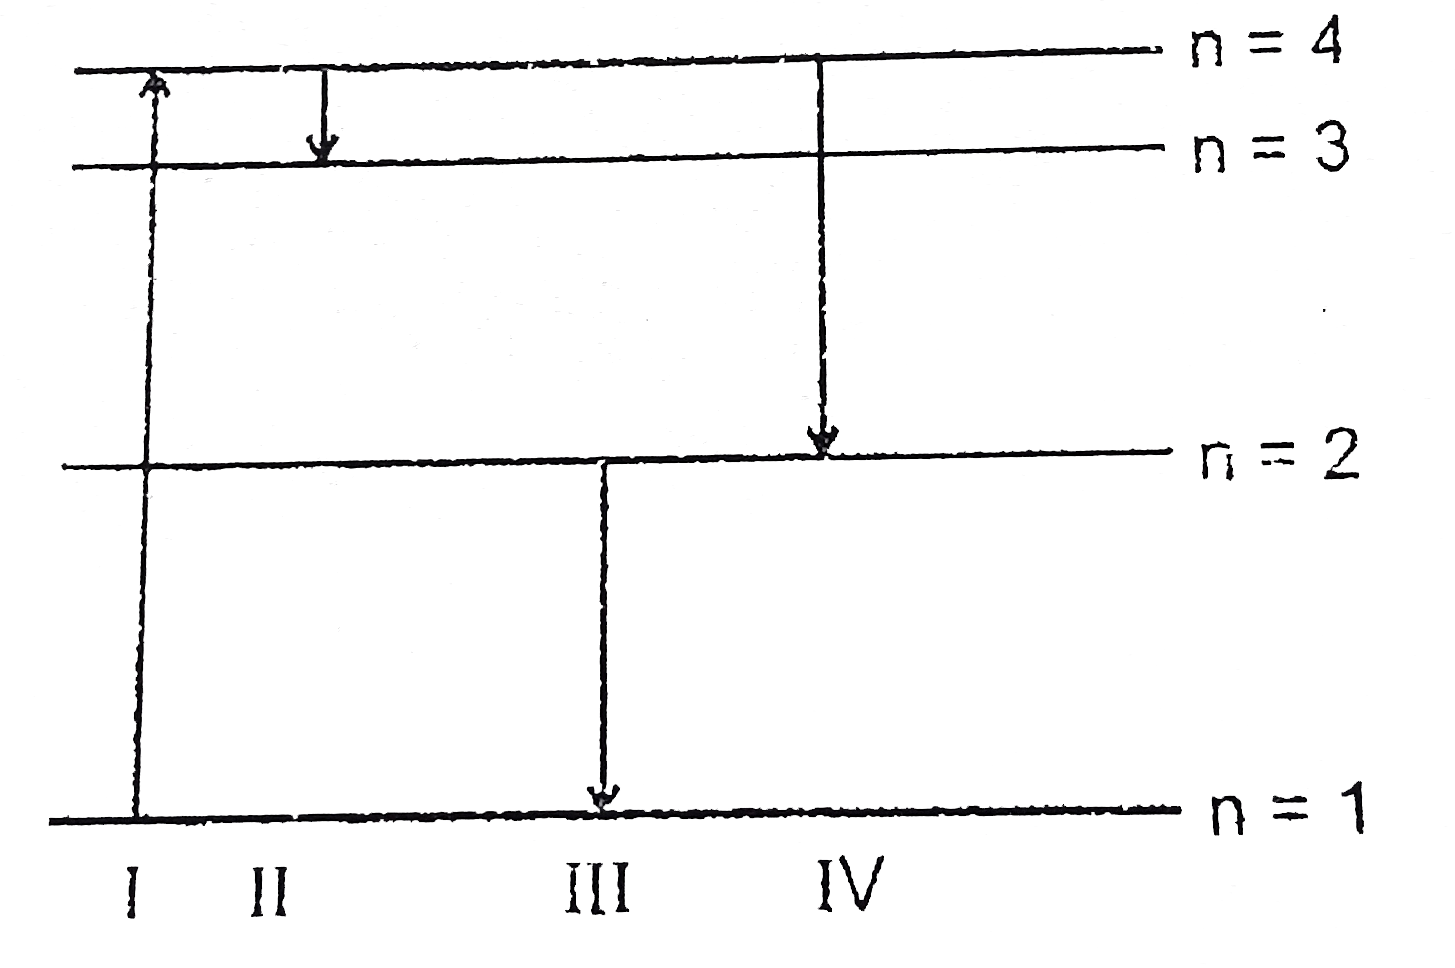 AIBIICIIIDIV
The diagram shows the energy levels for an electron in a certain atom. Which transition shown represents the emission of photon with the most enegy ?

View SolutionThe energy levels of a hypothetical aton are shown below. Which of the shown transitions will result in the emmission of a photon of wavelength 275 nm?
Which of these transitions correspond to emission of radiation of (i) maximum and (ii) minimum wavelength?
View SolutionOxygen differs from the other elements of the group. Compounds of oxygen with metals are more ionic in nature and hydrogen bonding is more important for oxygen compounds. Oxygen is never more than divalent beacasue when it hs formed two covalent bonds, there are no low energy orbitals which can be used for form. further bonds. However, the elements S,Se,Te and Po have empty d- orbitals which may be used for bonding, and they can form four or six bonds by unpairing electrons. The higher oxidation states become less stable on decending the group.
The bond between S and O, or Se and O, are much shorter than might be expected for a single bond owing to ρπ−dπ interaction between the p- orbital of oxygen and d- orbital of S or Se.
Which one of the following orders represents the correct order for the properties indicated against them?
View SolutionThe energy levels of a hypotherical one electron atom are shown in figure

Find the wave number of the photon emitted for the transition n=3→n=1
View SolutionThe energy levels of a cartain atom are shown in figure. If a photon of
frequency f is emitted when there is an electron transition from 5E to E
what frequencies of photons could be produced by other energy level transitions?

View SolutionIn figure E1andE2 represent some of the energy levels of the hydrogen atom.
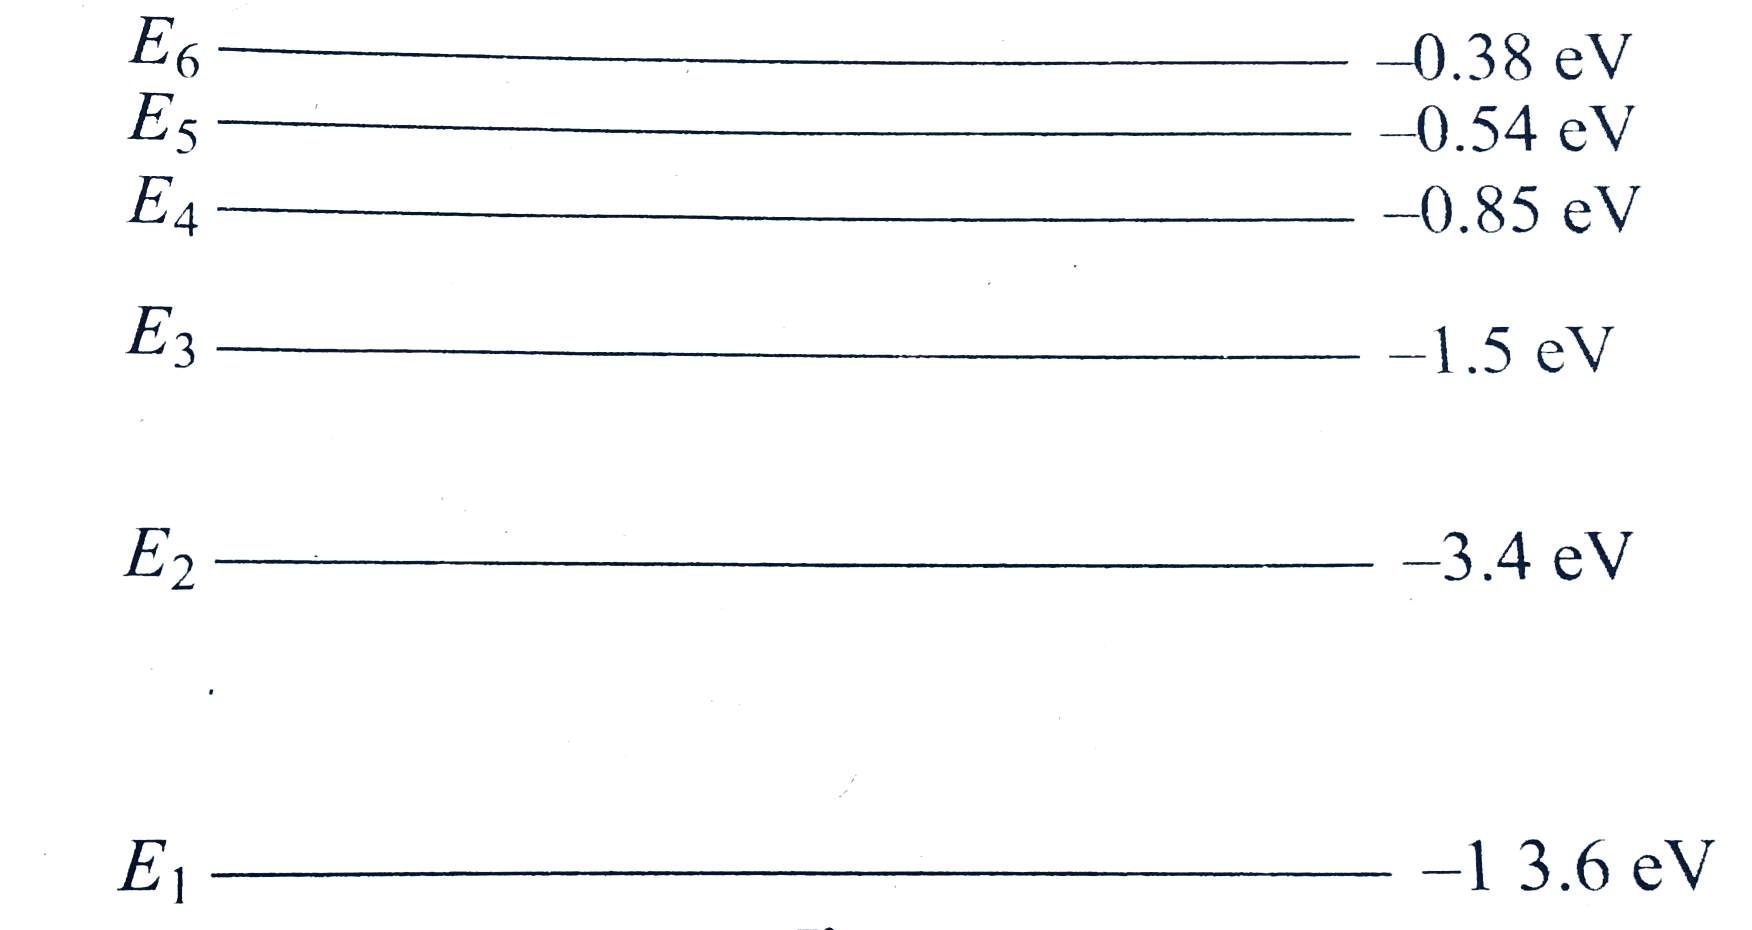
Which one of the following transitions produced a photon of wavelength in the ultraviolet region of the electromagnetic spectrum?
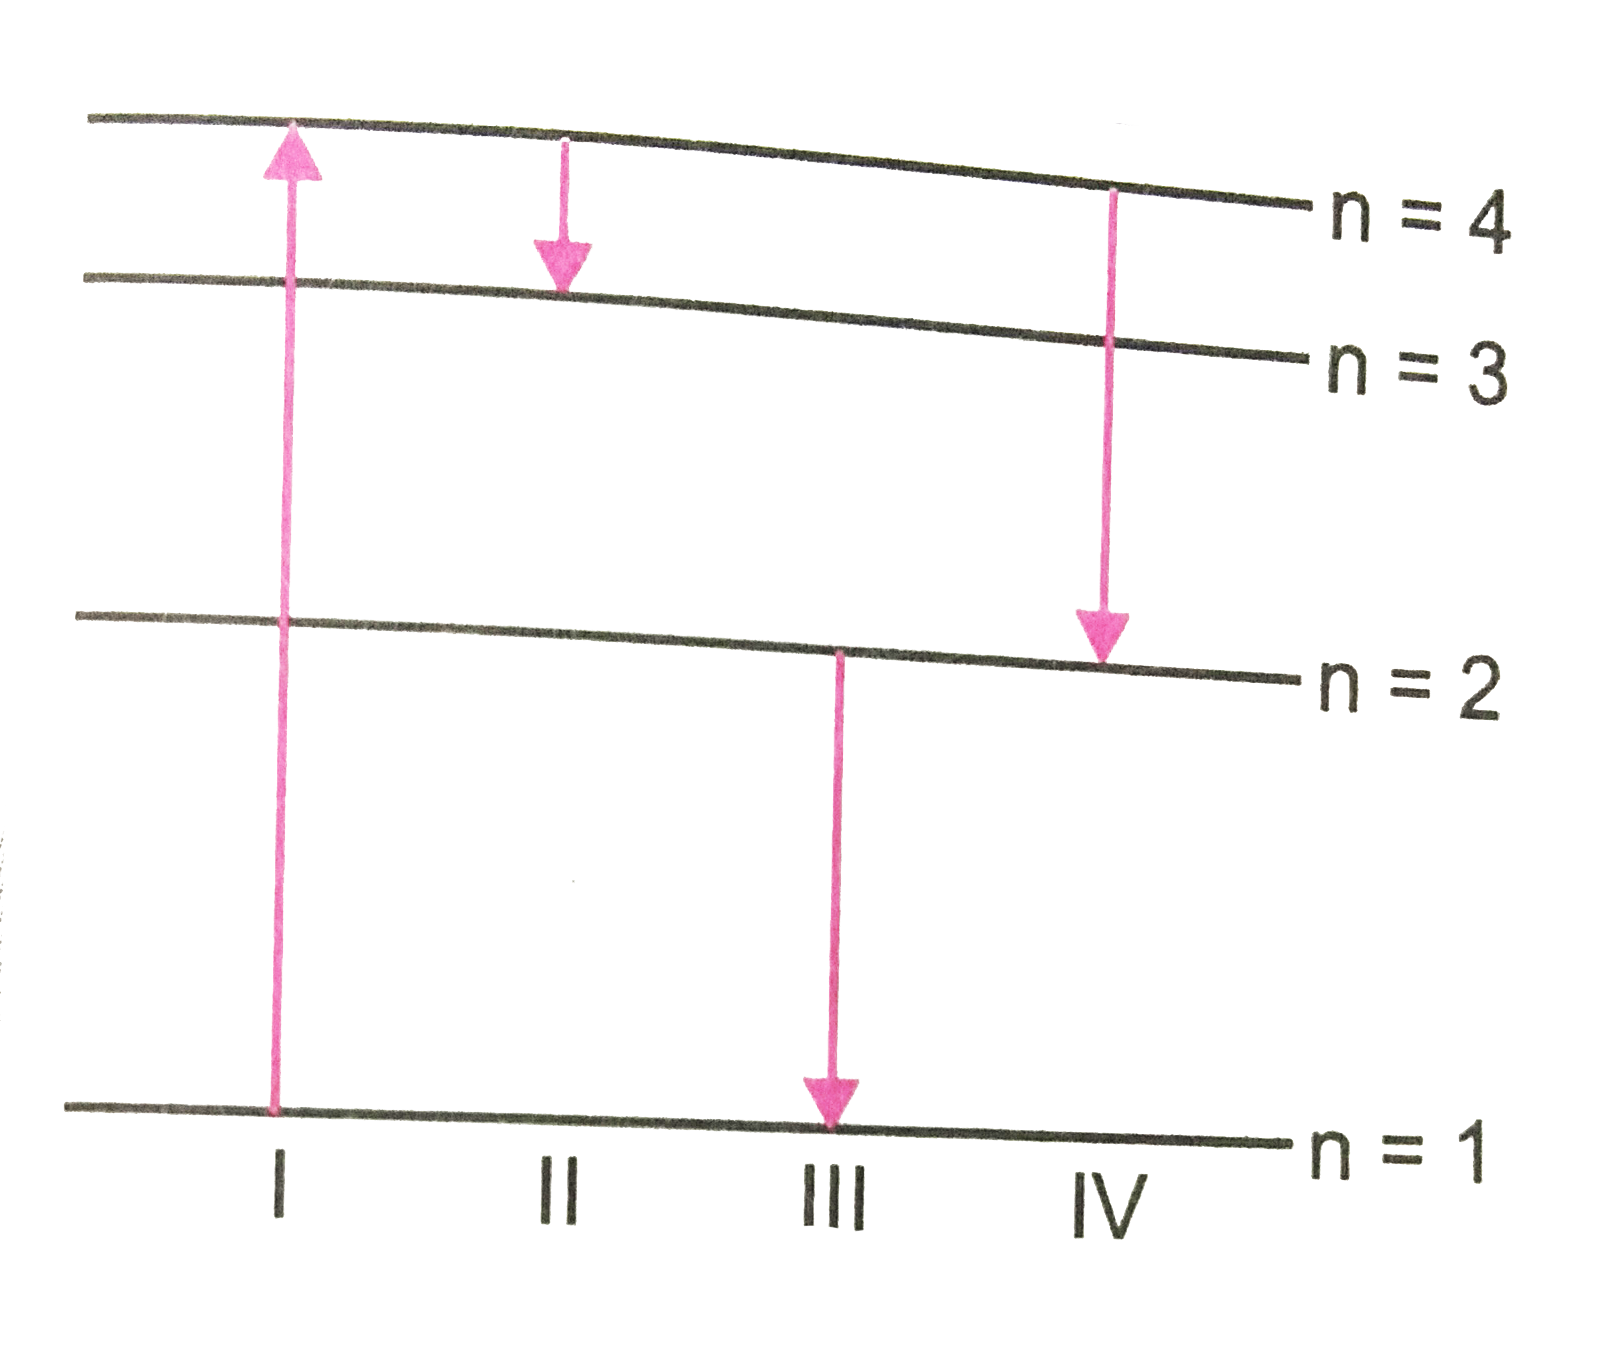
View SolutionThe figure shows an energy level diagram for the hydrogen atom. Several transitions are marked as I,II,III ,______, the diagram is only indicative and not to scale.
_E01_150_Q01.png) .
.
Which transition involves the longest wavelength line in the visible portion of the hydrogen spectrum
View Solution
