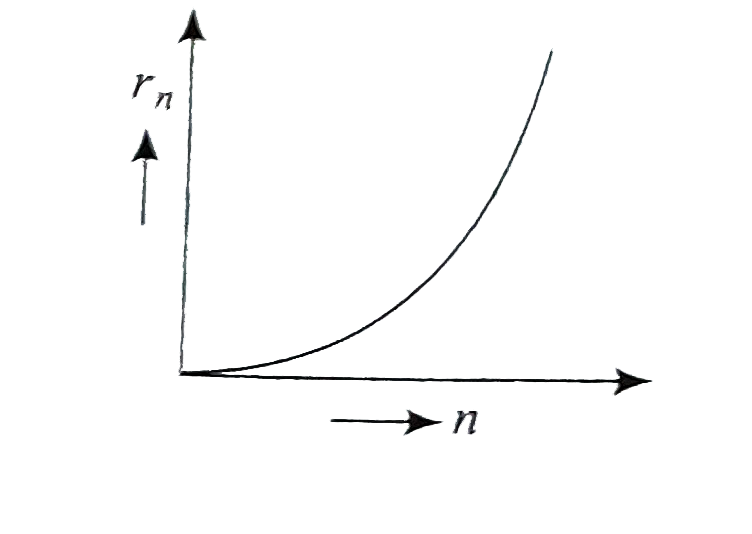
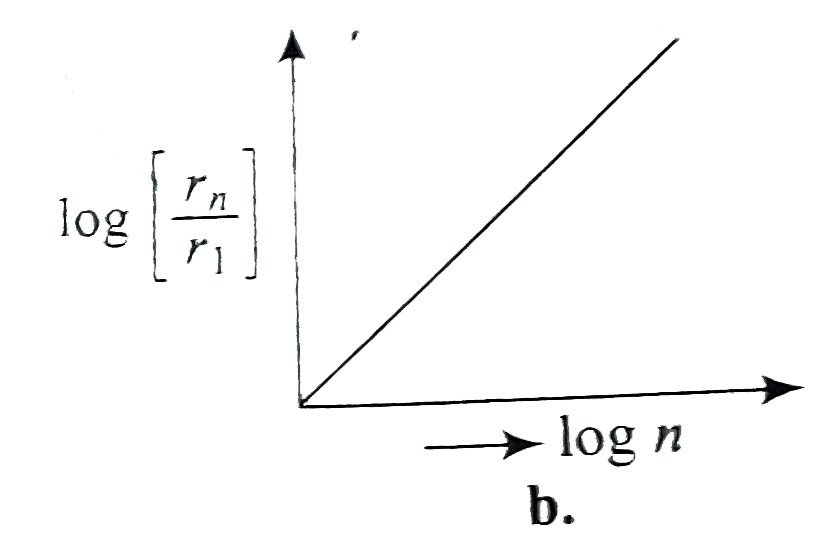
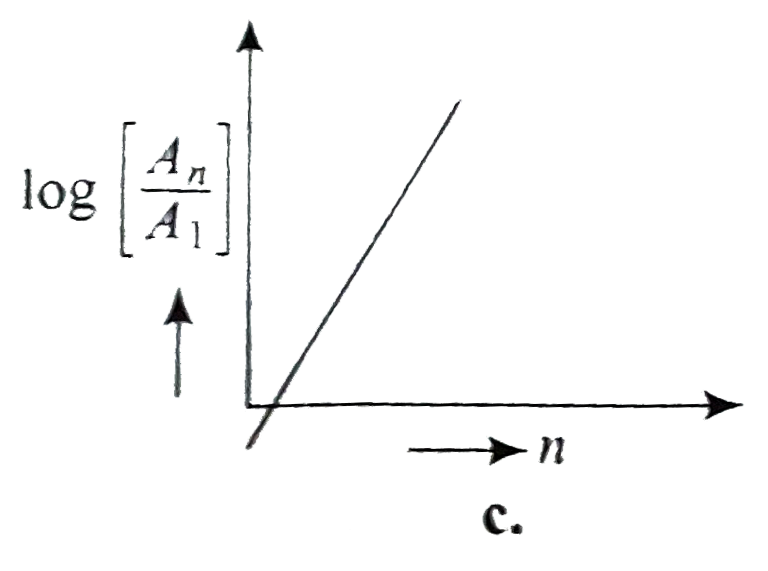
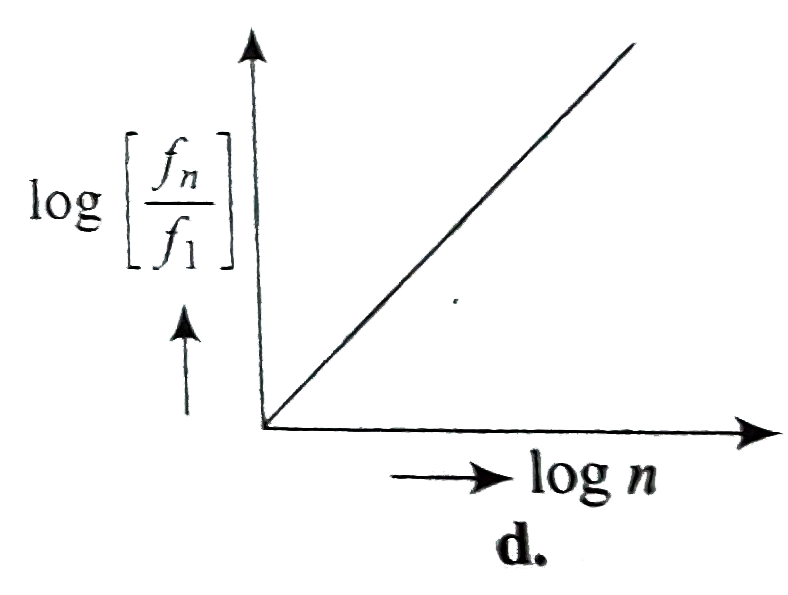
If, in a hydrogen atom, radius of nth Bohr orbit is rn frequency of revolution of electron in nth orbit is fn and area enclosed by the nth orbit is An , then which of the pollowing graphs are correct?
The correct Answer is:A, B, C
To solve the problem regarding the graphs related to the radius, frequency, and area of the nth Bohr orbit in a hydrogen atom, we will analyze each aspect step by step.
Step 1: Analyze the Radius of the nth Bohr Orbit
The radius of the nth Bohr orbit in a hydrogen atom is given by the formula:
rn∝n2
For hydrogen (where Z=1), this can be expressed as:
rn=k⋅n2
where k is a proportionality constant.
Graph Analysis:
- If we plot rn (y-axis) against n (x-axis), the relationship is quadratic. Therefore, the graph will be a parabola opening upwards.
Conclusion for Step 1:
The graph between rn and n is correct and should be a parabolic curve.
Step 2: Analyze the Logarithmic Relationship of Radius
Next, we consider the logarithmic relationship:
rnr1∝n2
Taking logarithms:
log(rnr1)=log(n2)=2log(n)
This indicates a linear relationship where the slope m=2.
Graph Analysis:
- If we plot log(rnr1) (y-axis) against log(n) (x-axis), we will get a straight line with a positive slope of 2.
Conclusion for Step 2:
The graph between log(rnr1) and log(n) is correct and is a straight line.
Step 3: Analyze the Area of the nth Bohr Orbit
The area An enclosed by the nth orbit is given by:
An∝r2n∝(n2)2=n4
Taking the ratio:
AnA1∝n4
Taking logarithms:
log(AnA1)=4log(n)
This indicates a linear relationship with slope m=4.
Graph Analysis:
- If we plot log(AnA1) (y-axis) against n (x-axis), we will get a straight line with a positive slope of 4.
Conclusion for Step 3:
The graph between log(AnA1) and n is correct and is a straight line.
Step 4: Analyze the Frequency of Revolution
The frequency fn of the electron in the nth orbit is inversely proportional to n3:
fn∝1n3
Thus, taking the ratio:
fnf1∝1n3
Taking logarithms:
log(fnf1)=−3log(n)
This indicates a linear relationship with a negative slope m=−3.
Graph Analysis:
- If we plot log(fnf1) (y-axis) against n (x-axis), we will get a straight line with a negative slope.
Conclusion for Step 4:
The graph between log(fnf1) and n is incorrect if it is shown as a positive slope.
Final Summary of Graphs:
1. Graph of rn vs. n: Correct (Parabolic)
2. Graph of log(rnr1) vs. log(n): Correct (Straight Line, slope = 2)
3. Graph of log(AnA1) vs. n: Correct (Straight Line, slope = 4)
4. Graph of log(fnf1) vs. n: Incorrect (Should have negative slope)
The radius of the nth Bohr orbit in a hydrogen atom is given by the formula:
rn∝n2
For hydrogen (where Z=1), this can be expressed as:
rn=k⋅n2
where k is a proportionality constant.
- If we plot rn (y-axis) against n (x-axis), the relationship is quadratic. Therefore, the graph will be a parabola opening upwards.
The graph between rn and n is correct and should be a parabolic curve.
Next, we consider the logarithmic relationship:
rnr1∝n2
Taking logarithms:
log(rnr1)=log(n2)=2log(n)
This indicates a linear relationship where the slope m=2.
- If we plot log(rnr1) (y-axis) against log(n) (x-axis), we will get a straight line with a positive slope of 2.
The graph between log(rnr1) and log(n) is correct and is a straight line.
The area An enclosed by the nth orbit is given by:
An∝r2n∝(n2)2=n4
Taking the ratio:
AnA1∝n4
Taking logarithms:
log(AnA1)=4log(n)
This indicates a linear relationship with slope m=4.
- If we plot log(AnA1) (y-axis) against n (x-axis), we will get a straight line with a positive slope of 4.
The graph between log(AnA1) and n is correct and is a straight line.
The frequency fn of the electron in the nth orbit is inversely proportional to n3:
fn∝1n3
Thus, taking the ratio:
fnf1∝1n3
Taking logarithms:
log(fnf1)=−3log(n)
This indicates a linear relationship with a negative slope m=−3.
- If we plot log(fnf1) (y-axis) against n (x-axis), we will get a straight line with a negative slope.
The graph between log(fnf1) and n is incorrect if it is shown as a positive slope.
1. Graph of rn vs. n: Correct (Parabolic)
2. Graph of log(rnr1) vs. log(n): Correct (Straight Line, slope = 2)
3. Graph of log(AnA1) vs. n: Correct (Straight Line, slope = 4)
4. Graph of log(fnf1) vs. n: Incorrect (Should have negative slope)
Topper's Solved these Questions
- BOOK - CENGAGE PHYSICS ENGLISHCHAPTER - ATOMIC PHYSICSEXERCISE - Multiple Correct13videos
ATOMIC PHYSICS
- BOOK - CENGAGE PHYSICS ENGLISHCHAPTER - ATOMIC PHYSICSEXERCISE - Linked Comprehension62videos
ATOMIC PHYSICS
- BOOK - CENGAGE PHYSICS ENGLISHCHAPTER - ATOMIC PHYSICSEXERCISE - Subject17videos
ATOMIC PHYSICS
- BOOK - CENGAGE PHYSICS ENGLISHCHAPTER - ALTERNATING CURRENTEXERCISE - Single Correct10videos
ALTERNATING CURRENT
- BOOK - CENGAGE PHYSICS ENGLISHCHAPTER - CAPACITOR AND CAPACITANCEEXERCISE - Integer5videos
CAPACITOR AND CAPACITANCE
Similar Questions
Knowledge Check
- Question 1 - Select One
In a hydrogen atom, the radius of nth bohr orbit is rn. The graph between log (rn/r1) and logn will be
A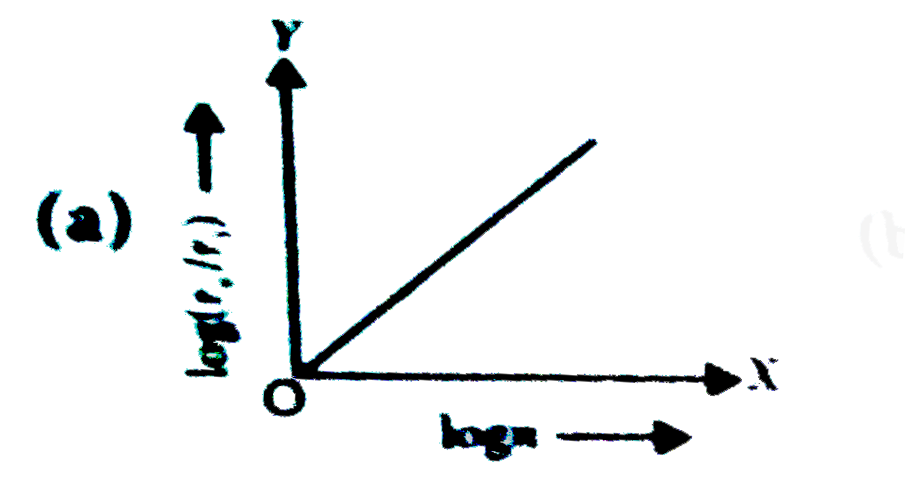 B
B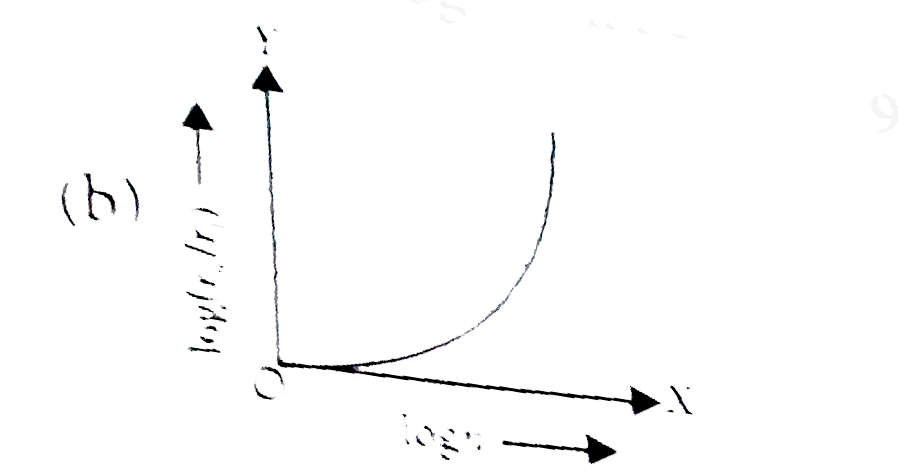 C
C D
D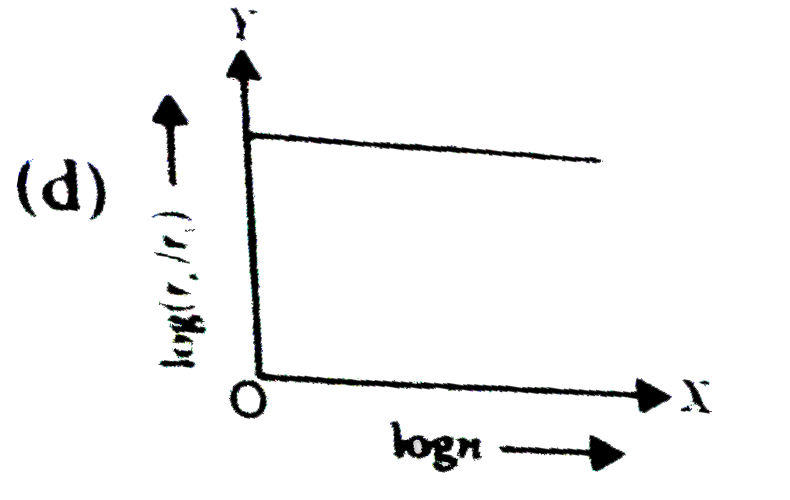
- Question 2 - Select One
In Bohr.s model of hydrogen atom, radius of the first orbit of an electron is r0. Then, radius of the third orbit is:
Ar09Br0C3r0D9r0
Determine the frequency of revolution of an electron in the second Bohr orbit in hydrogen atom
View SolutionThe radius of Bohr's first orbit is a0 . The electron in nthorbit has a radius :
View SolutionMagnetic moment of an electron in nth orbit of hydrogen atom is
View SolutionMagnetic moment of an electron in nth orbit of hydrogen atom is
View SolutionIn a hydrogen atom, the binding energy of the electron in the ground state is E1 then the frequency of revolution of the electron in the nth orbit is
View Solutionde-Broglie wavelength of an electron in the nth Bohr orbit is λn and the angular momentum is Jn then
View Solution

