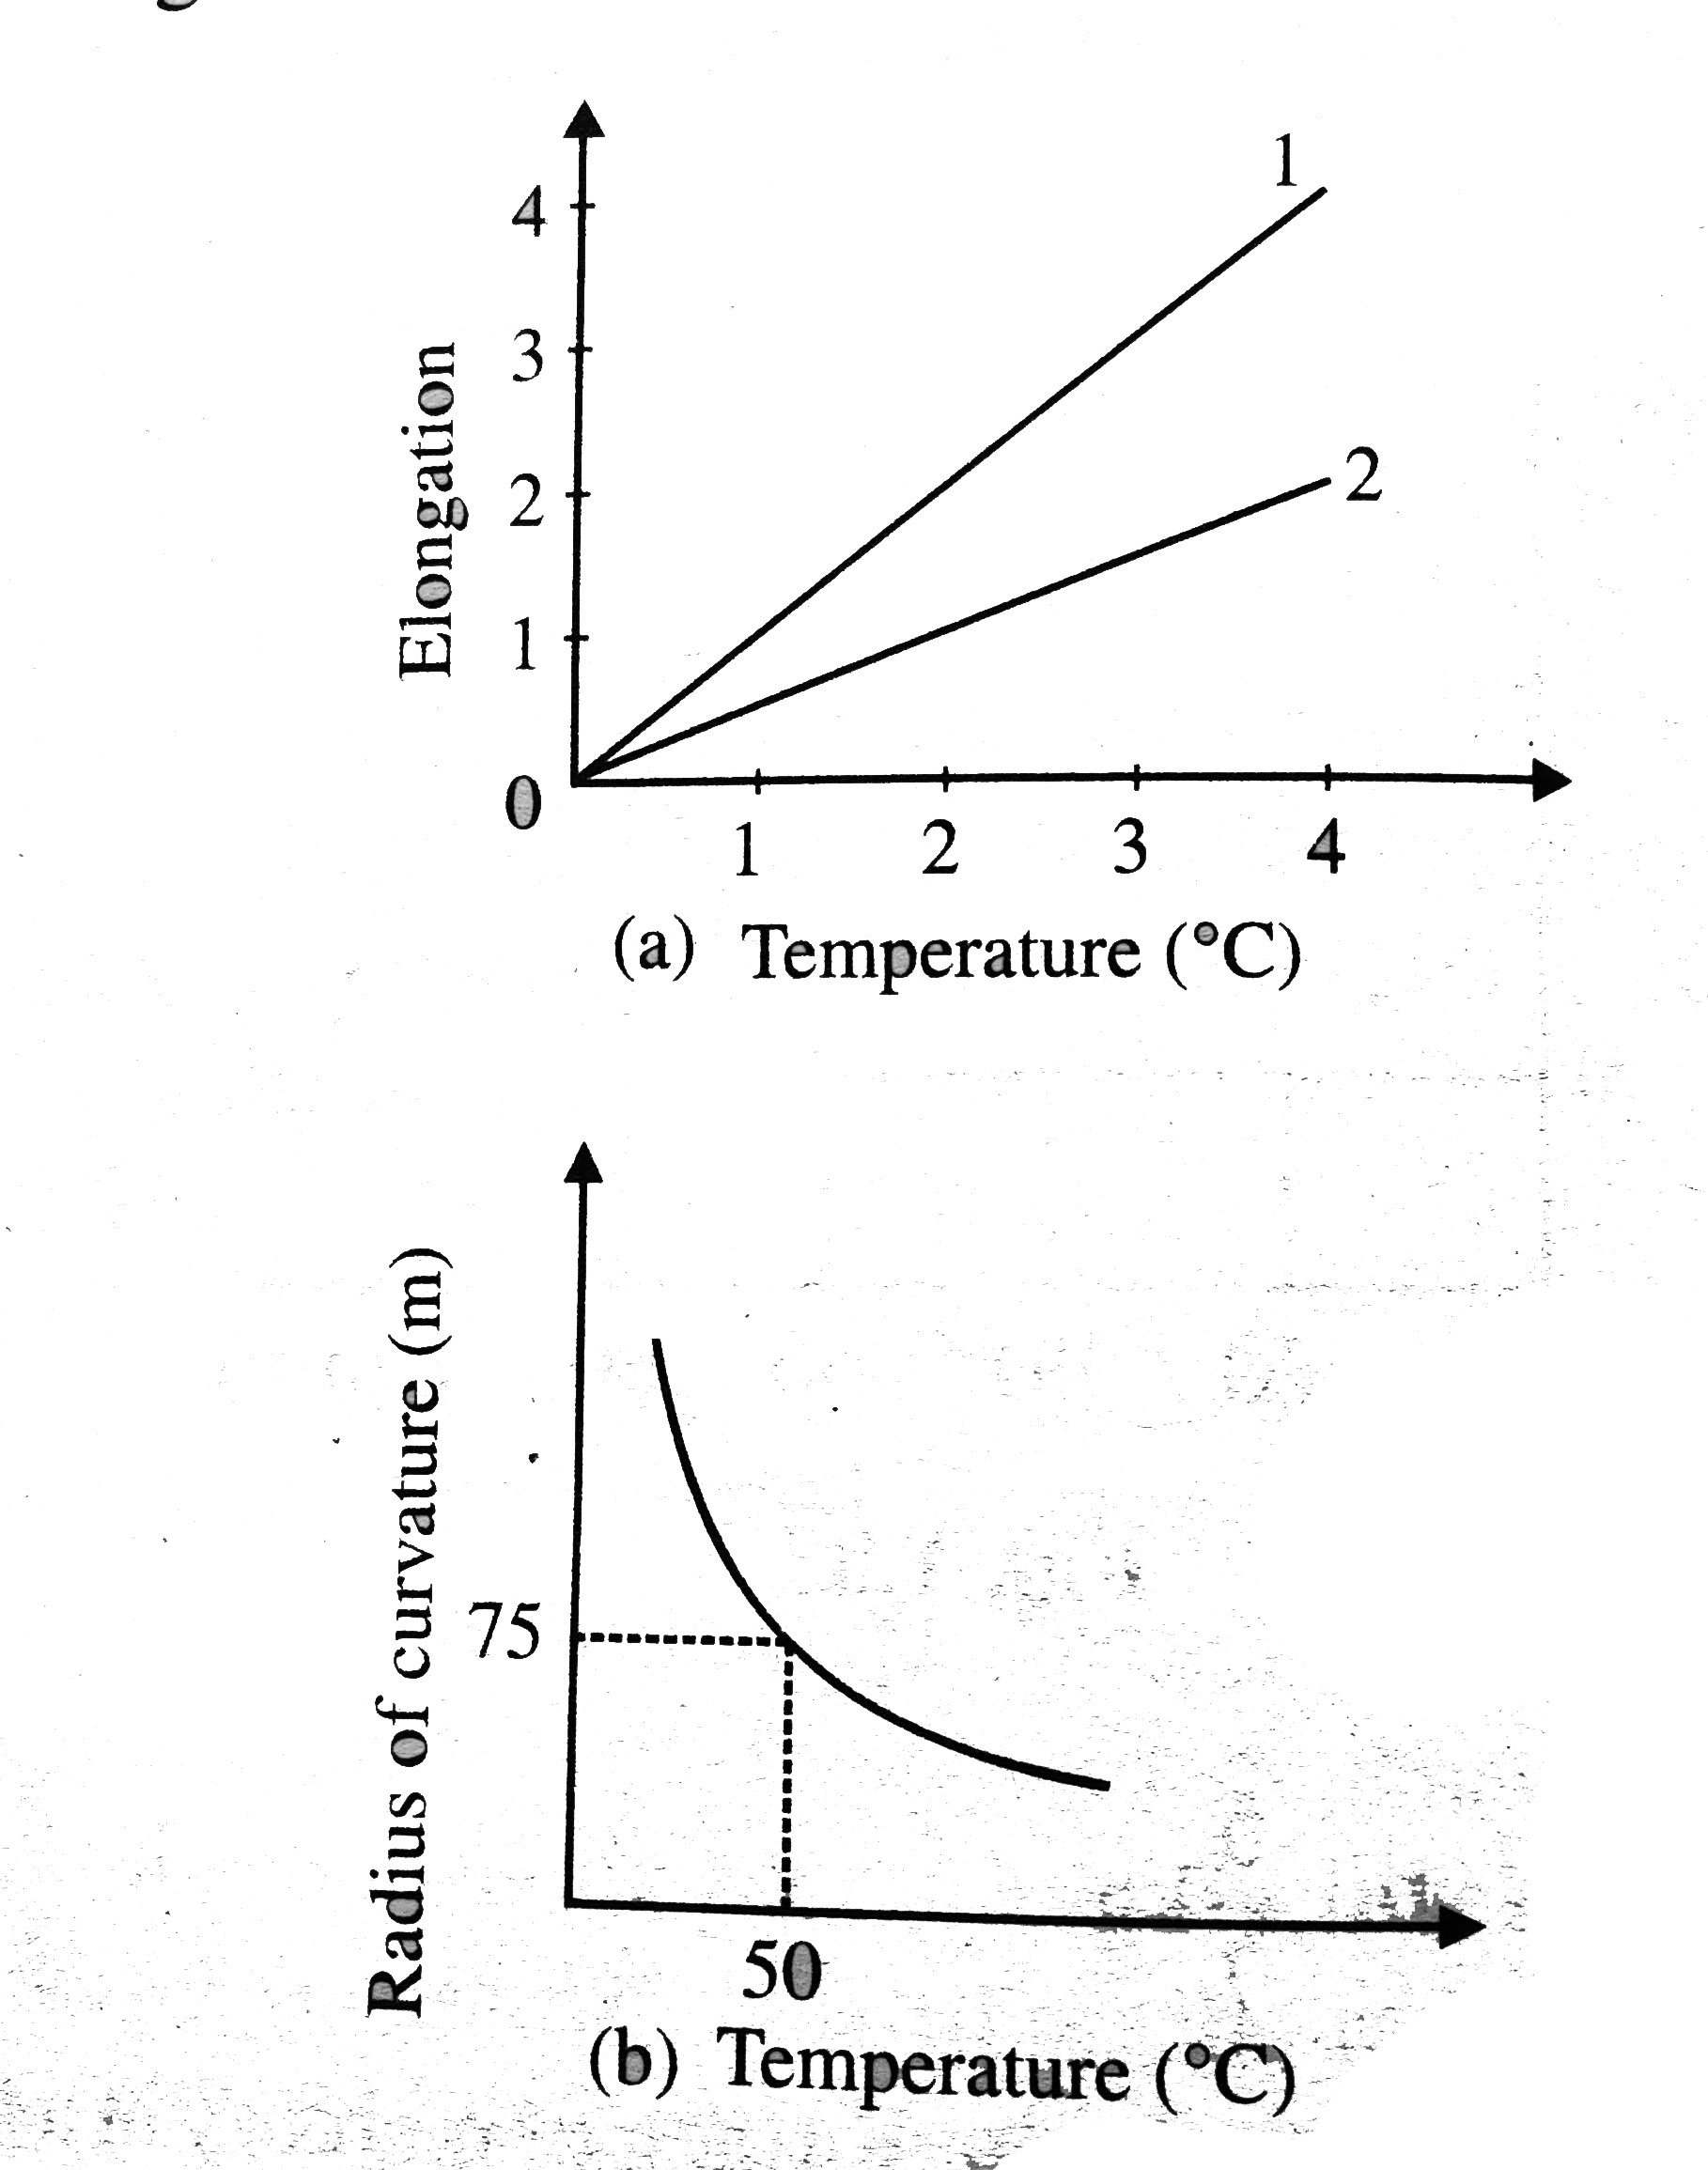
Figure. Shows the graphs of elongation versus temperature for two different metals. If these metals are employed to form a straight bimetallic strip of thickness 6 cm and heated, it bends in the form of an arc, the radius of cuvature chaging with temperature approximately as shown in the figure. The linear expansivities of the two metals are
24×10−6/∘C and 12×10−6/∘C
20×10−6/∘C and 10×10−6/∘C
18×10−6/∘C and 9xx10^(-6)//^@C
16×10−6/∘C and 8×10⁻⁶/∘C
The correct Answer is:D
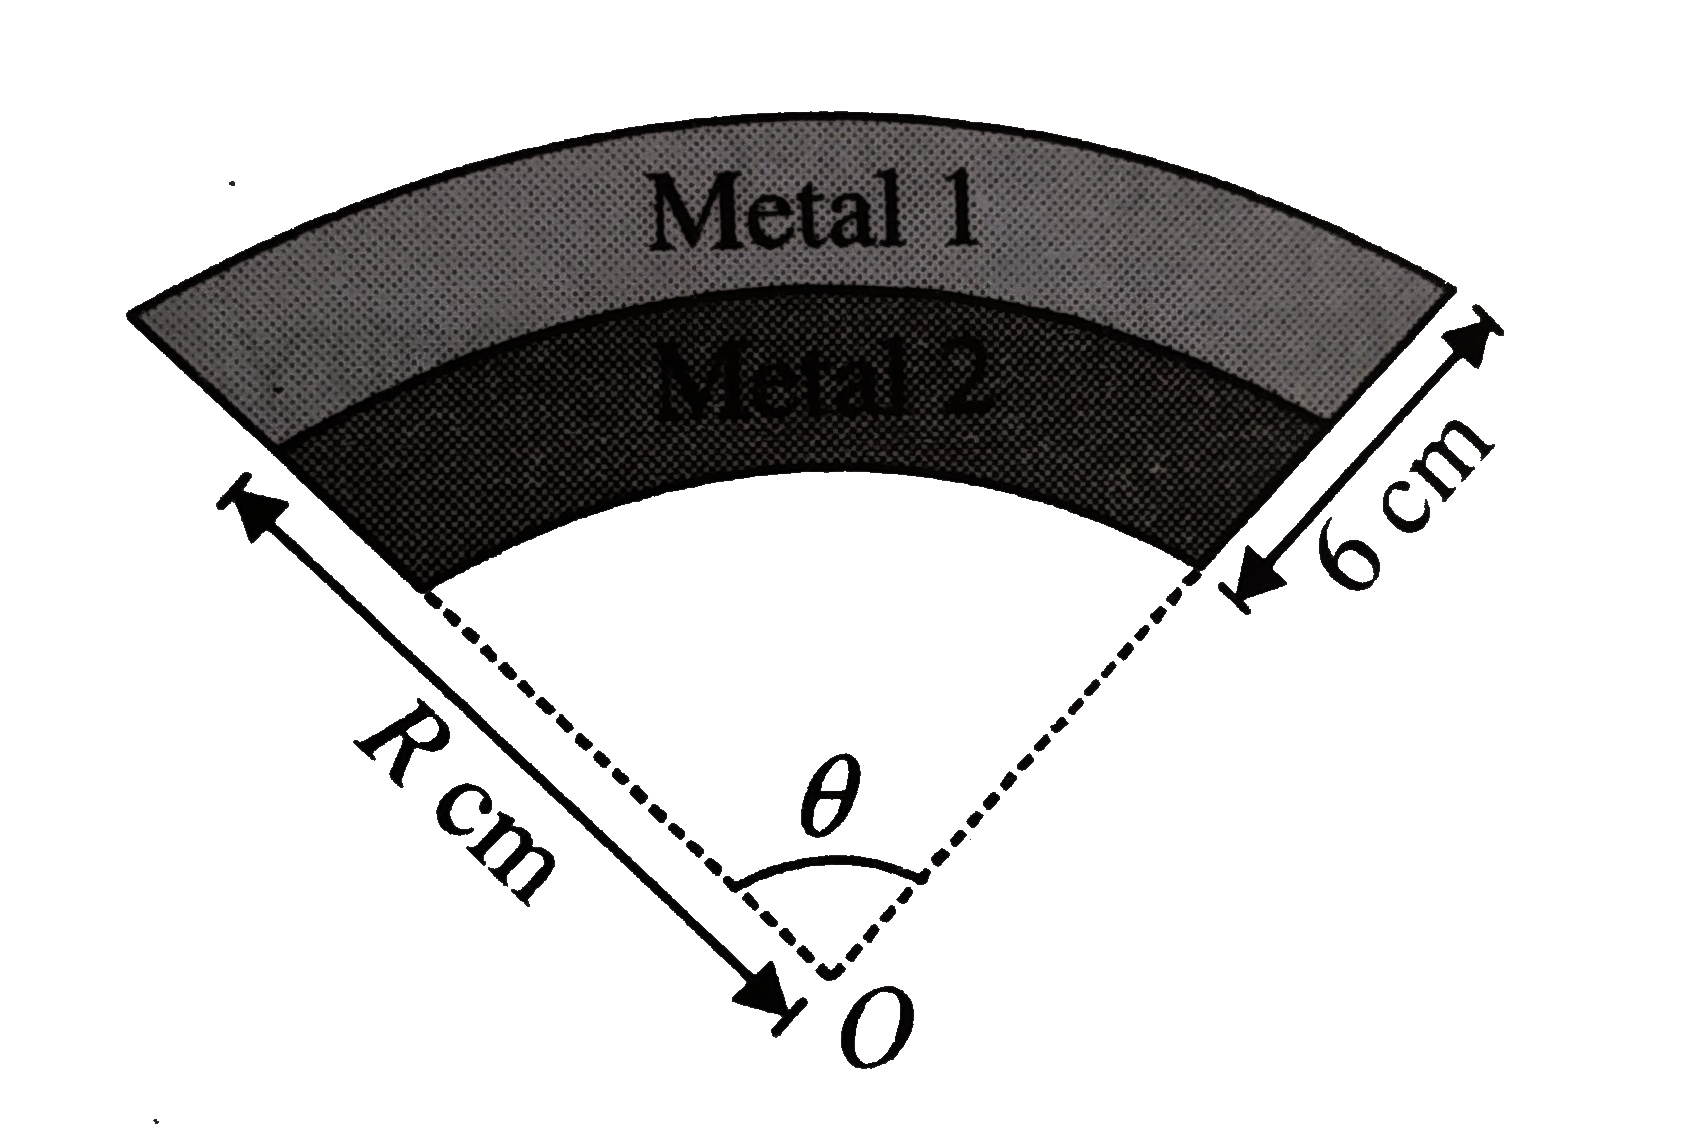
The slope of lines are
(ΔLΔT)1=Lα1=4−04−0=1 (For the first metal)
and (ΔLΔT)2=Lα2=2−04−0=12 (For the second metal)
and L0(1+α2T)=(R−1.5)θ
Dividing we get 1+α1T1+α2T=R+1.5R−1.5
or (α1−α2)T=3R and α1−α2=3RT from the graph shown in fig. (b)
α1−α2=37500×50=8×10⁻⁶/∘C
But α1α2=2
∴α1=16×10−6/∘C and a1=8×10⁻⁶/∘C
Topper's Solved these Questions
- BOOK - CENGAGE PHYSICS ENGLISHCHAPTER - CALORIMETRYEXERCISE - Multiple Correct25videos
CALORIMETRY
- BOOK - CENGAGE PHYSICS ENGLISHCHAPTER - CALORIMETRYEXERCISE - Comprehension30videos
CALORIMETRY
- BOOK - CENGAGE PHYSICS ENGLISHCHAPTER - CALORIMETRYEXERCISE - Subjective25videos
CALORIMETRY
- BOOK - CENGAGE PHYSICS ENGLISHCHAPTER - BASIC MATHEMATICSEXERCISE - Exercise 2.620videos
BASIC MATHEMATICS
- BOOK - CENGAGE PHYSICS ENGLISHCHAPTER - CENTRE OF MASSEXERCISE - INTEGER_TYPE1videos
CENTRE OF MASS
Similar Questions
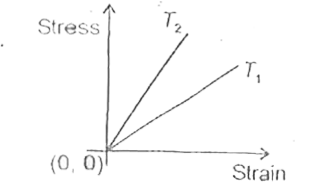
Figure shows graph between stress and strain for a uniform wire at two different temperatures. Then
 View Solution
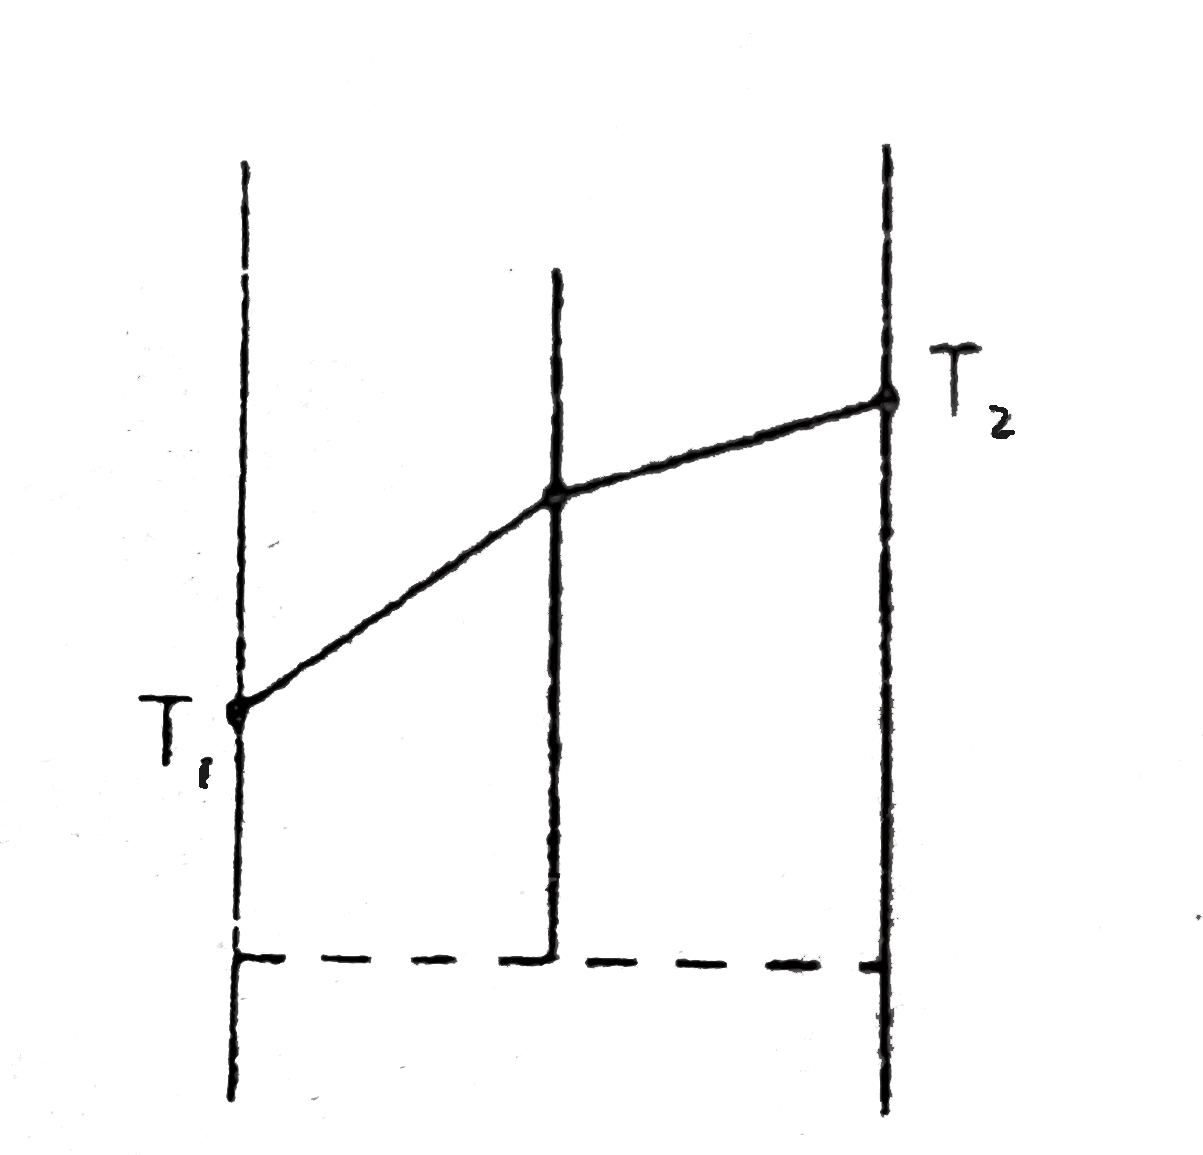
The wall of a house is made of two different materials of same thickness. The temperatures of the outer wall is T2 and that of inner wall is T1<T2. The temperature variation inside the wall as shown in the figure. Then :
 View Solution
A bimetallic strip is based on the principle that different metals have different thermal expansions for the same rise in temperature.
View SolutionA bimetallic strip is formed out of two identical strips one of copper and the other of brass. The temperature of the strip goes up by ΔTand the strip bends to from an arc of radius of curvature R. Then R is.
View Solution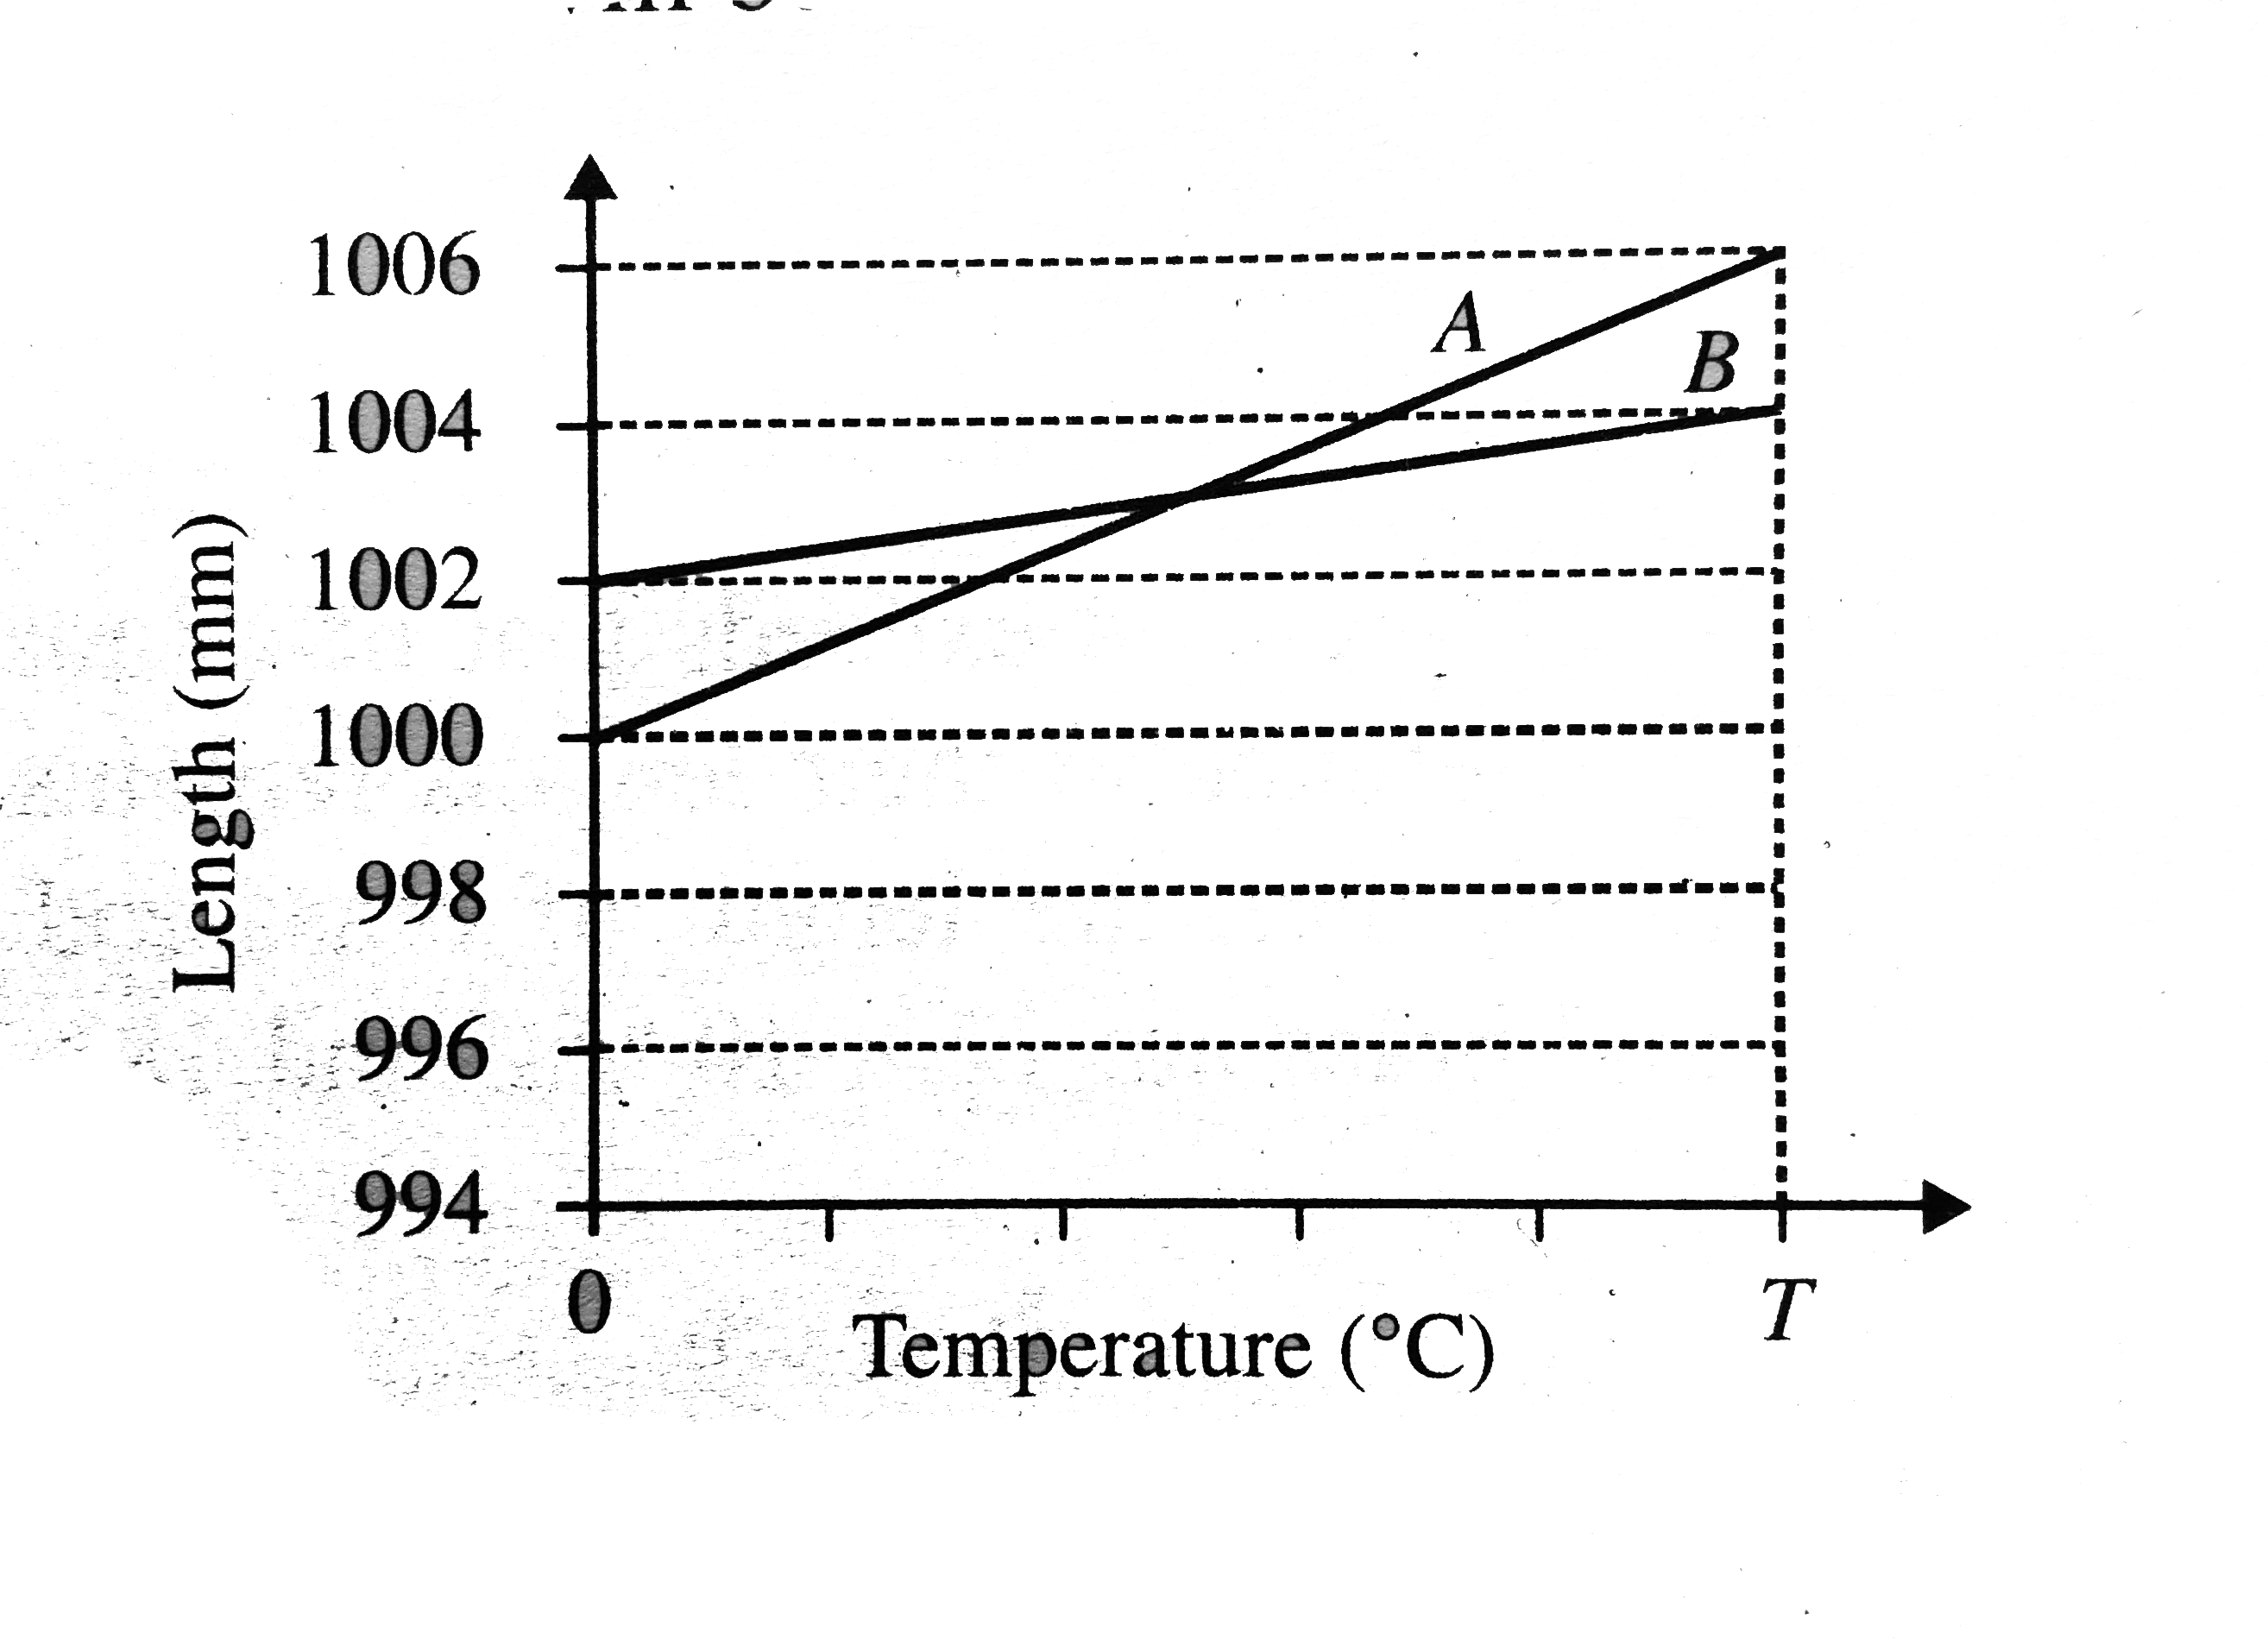
The variation of length of two metal rods A and B with change in temperature is shown in Fig. the coefficient of linear expansion αA for the metal A and the temperature T will beView Solutionfigures shows the expansion of a 2m long metal rod with temperature . The volume expansion coefficient the
metal is :-
_S01_079_Q01.png) View Solution
View SolutionBars of two different metals are bolted together , as shown in figure. The distance x does not change with temperature if :-
_E01_015_Q01.png) View Solution
View SolutionThe current - voltage graphs for a given metallic wire at two different temperatures T1andT2 are shown in the figure.
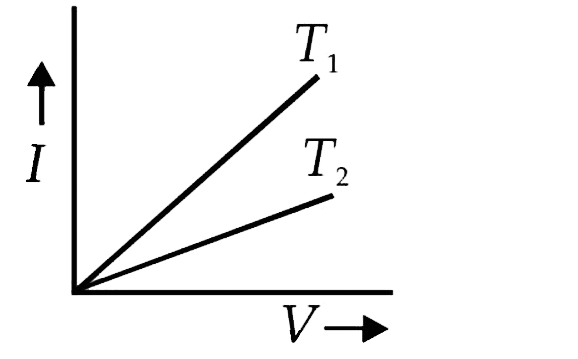
The temperature T2 is greater than T1.View SolutionThe current - voltage graphs for a given metallic wire at two different temperatures T1andT2 are shown in the figure.

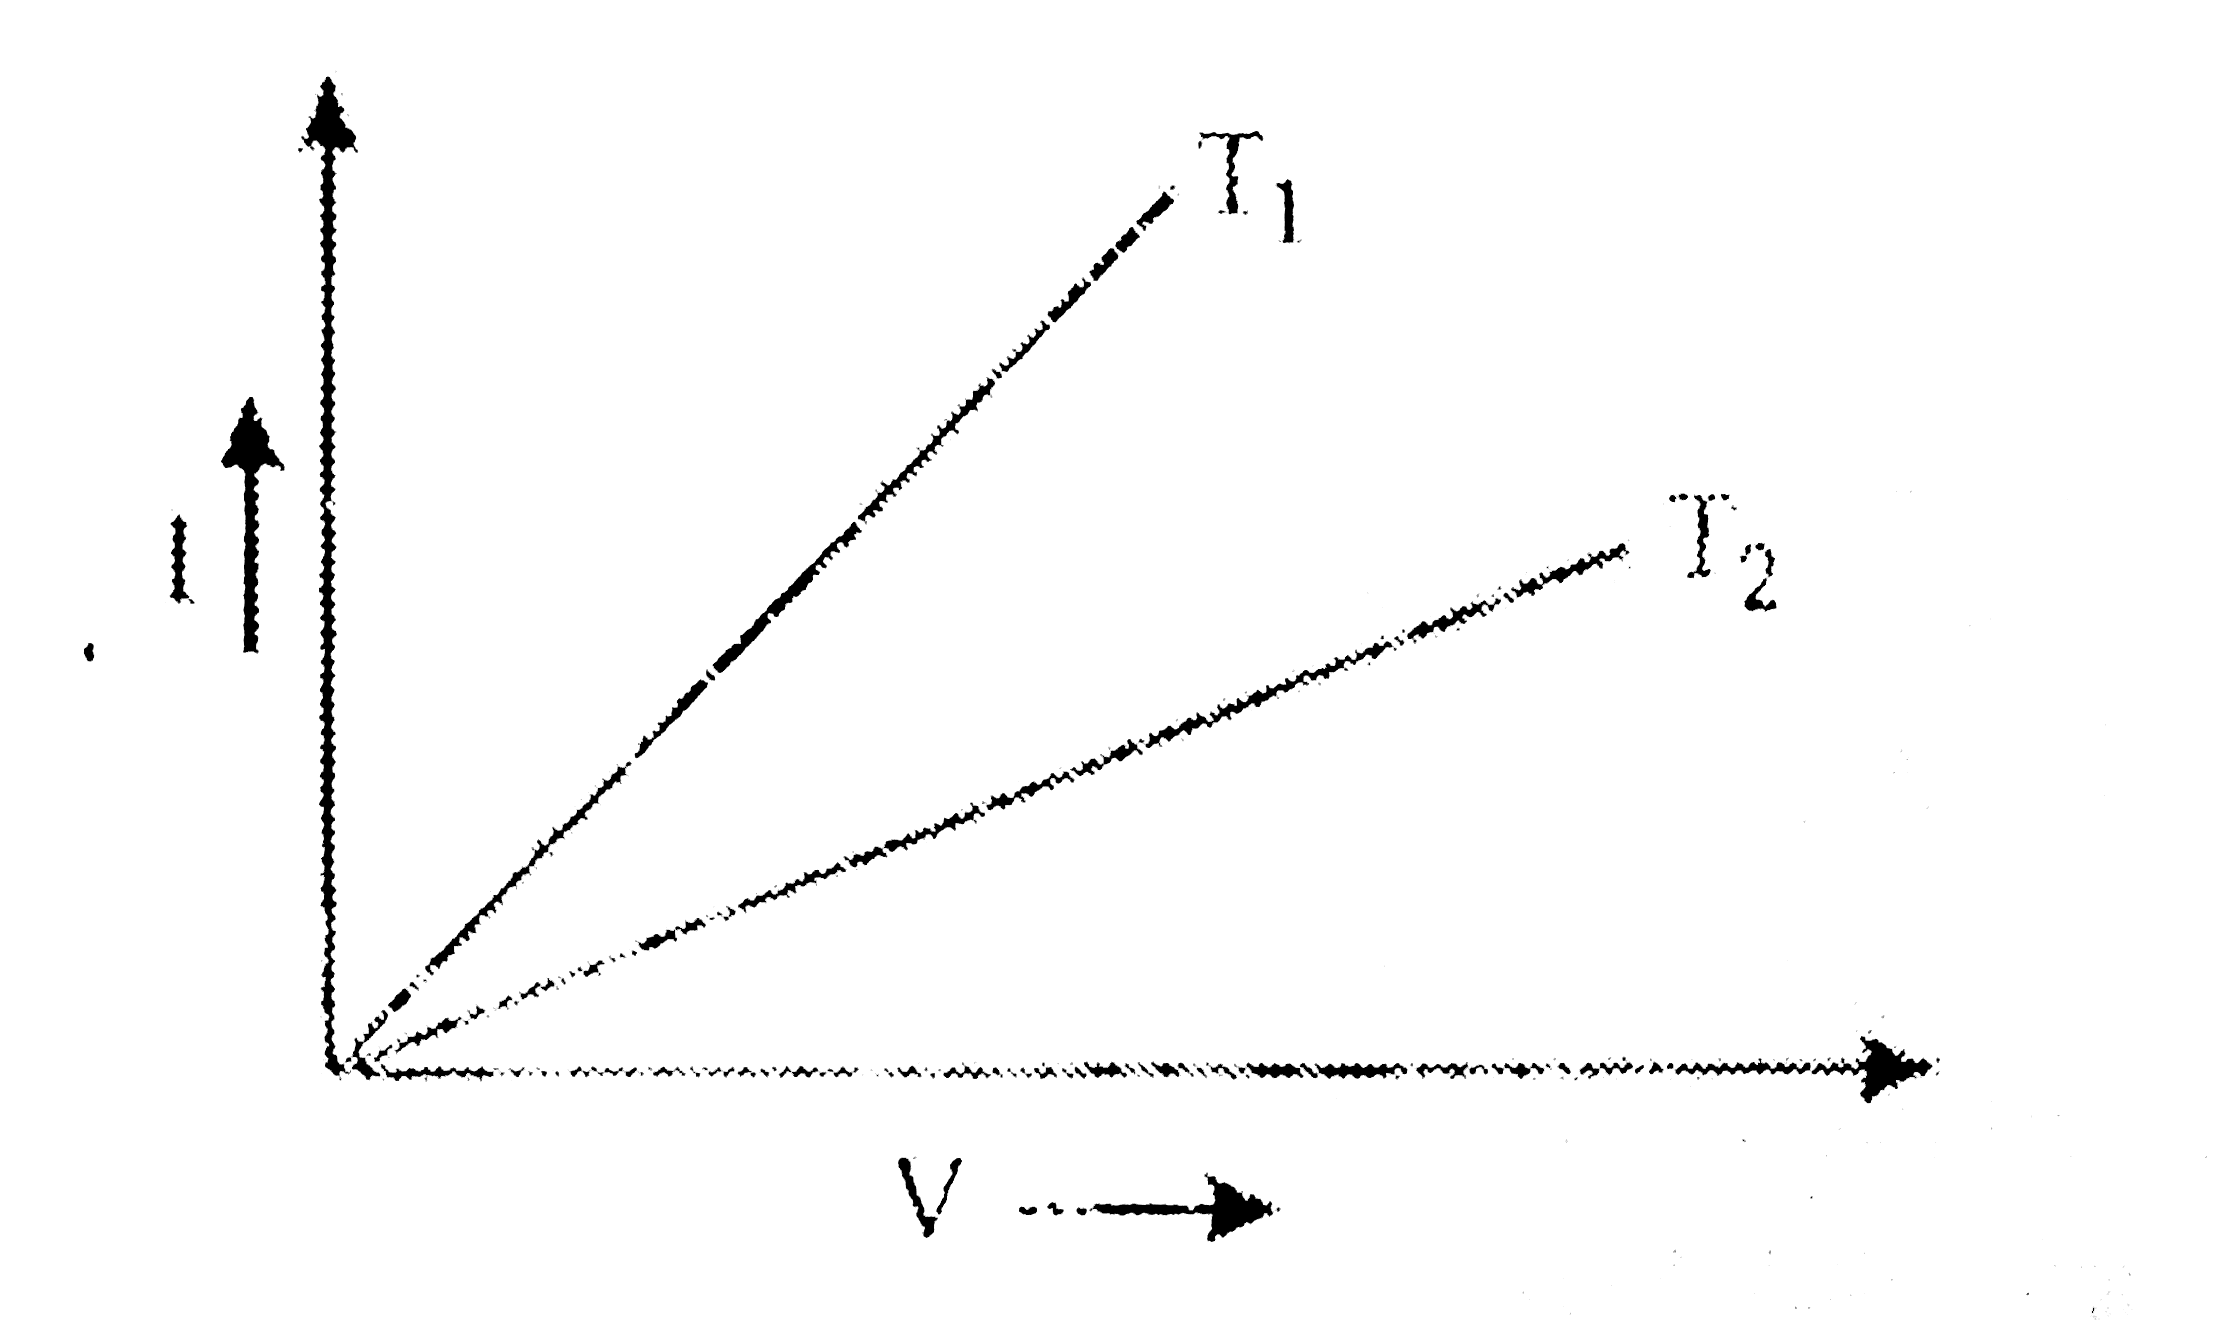
The temperature T2 is greater than T1.View SolutionI-V graph for a metallie wire at two different tempearture, T1andT2 is as shown in the figure. Which of the two temperatures is lower and why ?
 View Solution

